Imagine you had to drive a car without a dashboard. You wouldn’t know how much gas you had, if the engines were working fine, or how fast you were going. Well, it’s pretty much the same if you’re running a business without a clear sense of its finances. This is where the 3 statement financial model comes in.
It is like your own financial dashboard, helping you see where the money is coming from, where it’s going, and how these two connect.
Read: A Complete Guide to Financial Statement Analysis for Strategy Makers
A 3-statement financial model combines the income statement, balance sheet, and cash flow statement to give an overview of a company’s operations, profitability, and liquidity.
But how do you build such a financial system from scratch?
Let’s find out.
Step by Step Guide to Building a 3 Statement Financial Model
Step 1: Start with the Income Statement
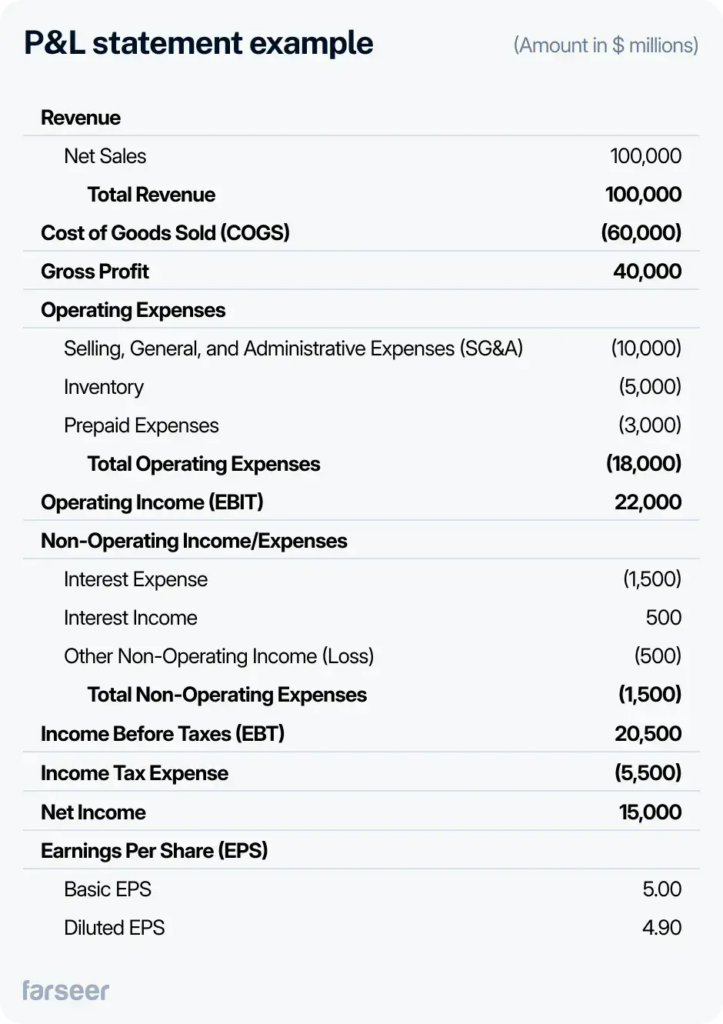
The income statement summarizes your company’s revenues, costs, and expenses over a specific period, showing whether the company made a profit or a loss.
Here are some of its components and how they contribute to calculating net income:
Revenue Projections
Begin by estimating your total sales or revenues for the period. This could be based on historical data, industry trends, or specific business goals.
Let’s say you own a coffee shop chain with 20 locations, each making around 300,000$ a year (6 million dollars together) and you’re planning to open 10 additional ones next year. These should perform similarly to the existing ones, but it should take them around half a year to get to this result based on your historical data. This means that the new locations should bring 50% of their potential revenue. The calculation would look something like this:
10 new locations×300,000×0.5=1,500,000$
So, combining the expected revenue from current locations and new stores, the projection for next year is:
6,000,000+1,500,000=7,500,000$
Bonus tip: If you want to be super accurate, you should break down revenues into key sources (e.g., product lines or service categories) so that you can easily see what are the primary drivers of income.
Cost of Goods Sold (COGS)
COGS refers to the direct costs associated with producing or purchasing the products you sell. This may include costs for materials, labor, and any other direct expenses tied to production. In our example, if we’re talking about coffee shops, these may (among others) refer to ingredients like coffee beans, milk, sugar, cups, etc.
When you subtract COGS from revenue, you get gross profit. This number tells you how much money is left to cover operating expenses after paying for production costs.
Operating Expenses
These are the costs of running the business, such as salaries, rent, utilities, and marketing. They’re often divided into selling, general, and administrative expenses (SG&A) to give a clearer picture of where costs come from.
When you subtract operating expenses from gross profit, you’re left with something called operating income or EBIT (Earnings Before Interest and Taxes).
Other Income and Expenses
Include any additional income sources (like interest income) and non-operating expenses (such as interest on debt). After adding or subtracting these, you’ll have pre-tax income.
Income Taxes
Calculate the tax expense based on applicable tax rates. Subtracting this from pre-tax income will give you net income.
So, the calculation for net income follows this general formula:
Net Income = Revenue − COGS − Operating Expenses − Other Expenses − Taxes
The net income figure from the income statement is deeply connected with other financial statements. It impacts retained earnings on the balance sheet and appears as a starting point in the cash flow statement under operating activities.

Step 2: Move to the Balance Sheet
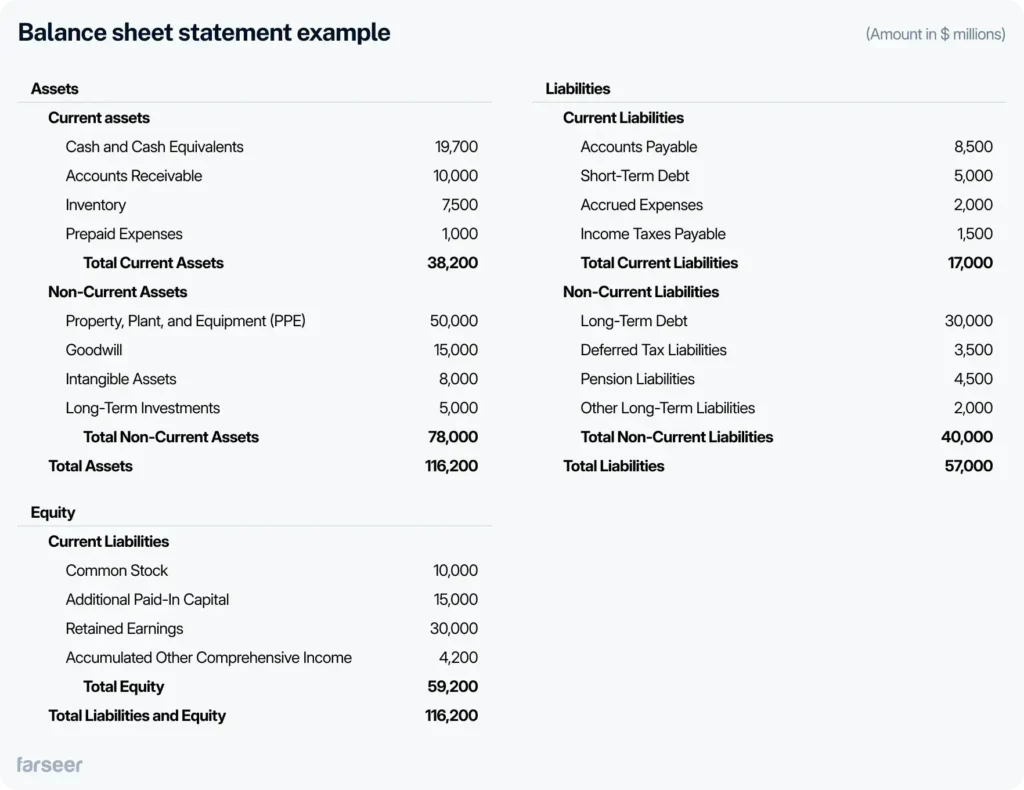
The balance sheet provides a snapshot of the company’s financial position by listing assets, liabilities, and equity. Here’s how each element contributes to the whole financial picture and how it connects to the income statement.
Assets
- Current Assets: These are assets that the company expects to convert into cash within a year. This can refer to e.g. cash, money owed by customers, and inventory.
- Non-Current Assets: These include long-term investments, property, equipment, and intangible assets like patents. Non-current assets aren’t meant for sales or converting into cash any time soon.
Liabilities
- Current Liabilities: This term refers to debts or obligations due within a year, such as money owed to suppliers, short-term loans, and accrued expenses, amounts owed for items like wages, utilities, interest, etc.
- Non-Current Liabilities: Long-term debts and other obligations due beyond a year, such as long-term loans or bonds payable.
Equity
- Equity represents the shareholders’ ownership of the company. It includes common stock, additional paid-in capital, and retained earnings.
Retained earnings specifically link back to the net income figure from the income statement. It’s a part of a company’s net income that it keeps or reinvests in the business, rather than paying out as dividends to shareholders. Over time, these retained earnings stack up, building up funds that can be used for growth, new projects, or other investments. This connection is essential because it allows the income statement to flow into the balance sheet, ensuring consistency across financial statements.
The formula for calculating retained earnings is:
Retained Earnings = Beginning Retained Earnings + Net Income – Dividends
In this way, net income from the income statement adds to retained earnings, which is a part of equity on the balance sheet. This shows how profit generated impacts the company’s financial position by increasing the value that shareholders own. Any dividends paid to shareholders reduce retained earnings, showing the outflow of value from the company to shareholders.
Linking Net Income to the Balance Sheet
When the net income flows from the income statement to retained earnings on the balance sheet, it impacts the overall equity. This integration highlights how the company’s profit (or loss) influences its financial health. For example, a profitable year will increase retained earnings, and boost shareholder equity, while a loss will decrease it.
This connection among assets, liabilities, and equity follows the fundamental accounting equation:
Assets = Liabilities + Equity
When you update retained earnings with net income, the balance sheet reflects not only the company’s current assets and liabilities but also the cumulative profits reinvested back into the business. This connection is crucial for investors and analysts to understand how a company’s performance and operations impact its overall financial position.

Step 3: Link to the Cash Flow Statement
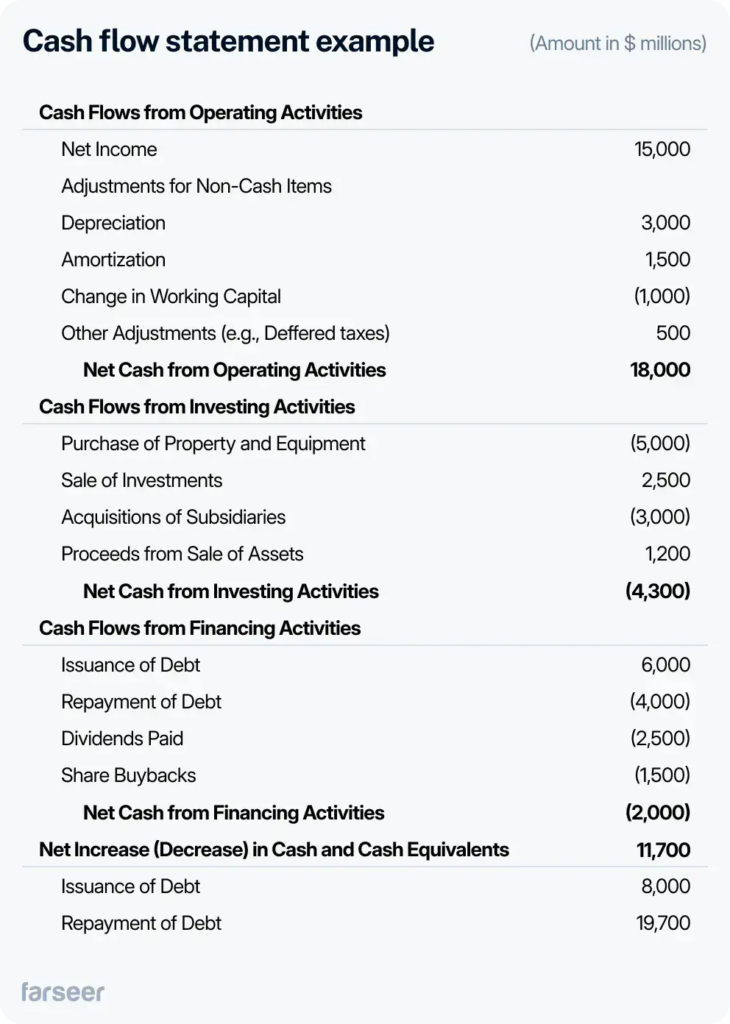
The cash flow statement shows how cash moves in and out of the business. This step connects directly to both the income statement and the balance sheet, providing insight into operating, investing, and financing activities. Let’s break down each component and see how they link to the other statements.
Adjustments for Non-Cash Items
The cash flow statement starts with net income from the income statement. Then, it adjusts for any non-cash items (like depreciation) to show the actual cash coming in and going out of the business. This ensures the statement accurately reflects real cash movements, rather than just accounting profits.
For example, if depreciation is listed as an expense on the income statement, it reduces net income but doesn’t actually reduce cash. So, it’s added back in the cash flow statement under operating activities.
Other Non-Cash Items include changes in deferred taxes, stock-based compensation, and gains/losses on asset sales. They are also taken into concern in this part.
Operating Activities
This section begins with net income and adjusts for non-cash items and changes in working capital (current assets and liabilities) found on the balance sheet.
Changes in Working Capital:
- Accounts Receivable (AR): If accounts receivable increases, it means the company has made sales on credit but hasn’t received the cash yet. For example, if your coffee shop sells $10,000 worth of coffee but customers will pay later, this $10,000 is recorded as AR. Because cash hasn’t come in yet, this increase is subtracted from the operating cash flow.
- Inventory: When inventory increases, it indicates that cash has been spent on products that haven’t been sold yet. For instance, if your coffee shop bought $5,000 worth of coffee beans and baked goods for future sales, this amount reflects cash that’s tied up in inventory. Since it represents money spent but not yet generating revenue, this increase is also subtracted from cash flow.
- Accounts Payable (AP): If accounts payable increase, it means the company owes more money to suppliers but hasn’t paid them yet. For example, if your coffee shop ordered $3,000 worth of coffee beans but hasn’t paid the supplier yet, this represents cash that the company still has on hand. Therefore, this increase in AP is added back to the operating cash flow because it shows cash savings.
After these adjustments for accounts receivable, inventory, and accounts payable, you arrive at cash from operating activities. This figure reflects how much cash is generated or used by the company’s core business operations. In this way, you get insights into a business’s ability to generate cash from day-to-day activities.
Investing Activities
The Investing Activities section shows cash flows from buying or selling long-term assets, such as equipment, buildings, or investments. These activities often reflect the company’s efforts to grow or upgrade its operations.
- Capital Expenditures (CapEx): When the company purchases assets, like new equipment, this cash outflow is recorded as a negative number. For example, if your coffee shop buys a new espresso machine for $5,000, this amount would be listed as -5,000 in the investing activities section, as cash was spent.
- Sales of Assets: When the company sells assets, such as an old delivery van, it receives cash, which is recorded as a positive number. If Java House sells the van for $3,000, this amount would appear as +3,000 in the investing activities, reflecting cash received from the sale.
In general, investing activities usually involve cash outflows for purchasing assets to grow the business. However, when the company sells assets, it brings in cash. And this shows how it manages funds both for growing the business and for getting rid of assets it no longer needs.
Financing Activities
The Financing Activities section shows cash flows related to raising funds (like loans or stock sales) and returning money to investors (like loan repayments or dividends).
- Borrowings and Repayments: When a company takes out a loan, it receives cash, which is recorded as a cash inflow. For example, if your coffee house borrows $50,000 to expand its operations, this amount appears as +50,000. On the other hand, if it pays back $10,000 of a loan, it’s recorded as a -10,000 cash outflow.
- Dividends Paid: Dividends are cash payments made to shareholders. If your business decides to pay $5,000 in dividends, this amount is recorded as -5,000 in the financing section, reflecting a cash outflow that returns value to investors.
Overall, the Financing Activities section provides insight into how the company raises money for operations and growth (through loans or equity) and how it rewards investors by repaying debt or paying dividends.
Linking the Cash Flow Statement to the Other Statements
The net income figure from the income statement is the starting point for cash from operating activities.
- Changes in working capital items (such as accounts receivable, inventory, and accounts payable) come from the balance sheet and affect operating cash flow.
- CapEx and other asset transactions from the cash flow statement impact property, plant, and equipment on the balance sheet.
- Financing activities affect the debt and equity sections on the balance sheet.
At the end of the cash flow statement, you calculate the net change in cash for the period. This is then added to the beginning cash balance (from the previous balance sheet) to arrive at the ending cash balance. This final cash figure connects to the cash line on the current balance sheet, completing the cycle and linking all three statements together.

Step 4: Link the statements together
Now let’s see how these 3 financial statements interact:
- Net Income: Flows from the Income Statement to the Cash Flow Statement as the starting point for cash from operations, and also to Retained Earnings on the Balance Sheet.
- Depreciation: Added back to net income on the Cash Flow Statement since it’s a non-cash expense. It reduces PP&E (property, plant, equipment or the company’s physical assets) on the Balance Sheet over time.
- Capital Expenditures (CapEx): Recorded as cash outflows in the Investing section, adding to PP&E on the Balance Sheet.
- Changes in Working Capital: Items like Accounts Receivable and Accounts Payable affect cash flow, showing sales on credit or deferred payments.
- Financing Activities: Borrowing money increases cash flow and Debt on the Balance Sheet, while loan repayments and dividends are outflows that reduce cash and retained earnings.
Check that the ending cash balance matches on both the Cash Flow Statement and Balance Sheet, and ensure Retained Earnings align with net income after dividends. Finally, when you link these statements properly, you can easily get a clear financial picture.
How to Make Sure Your 3 Statement Financial Model is Accurate
For accuracy, it’s essential to regularly validate figures and cross-check linked cells to prevent errors in a 3-statement financial model. Simplifying the model through clear formatting and straightforward calculations helps maintain clarity and ease of understanding, especially when sharing with others.
Leveraging software like Excel or Google Sheets can help automate these checks with built-in formulas, while dedicated financial modeling tools like Farseer offer more advanced features for handling complex models. For additional support, many online courses and templates are available to guide you in building and refining 3-statement models. No matter if you’re new to financial modeling or looking to enhance your skills further.
Read 5 Best Financial Analysis Tools to Look Out For in 2025
Conclusion
A 3-statement financial model is essential for understanding a company’s financial health, predicting future performance, and making informed decisions. By integrating the income statement, balance sheet, and cash flow statement, this model provides a comprehensive view of how profitability, liquidity, and overall financial position are intertwined.
Practicing these models helps you refine your skills and build confidence, so don’t hesitate to start creating your own. If you’d like to see how Farseer can help you along the way, don’t hesitate to book a demo and talk with our experts.


