Account analysis is one of the most powerful tools you can use to stay on top of your company’s financial health. Most commonly used by accountants and FP&A analysts, this method provides the in-depth insights you need to make smarter decisions. It’s used for fine-tuning your budget, tracking trends, optimizing your forecasts, and keeping your company compliant.
In this blog, we’ll dive into practical steps and tips to make the most of account analysis. So read on.
Related: A Complete Guide to Financial Statement Analysis for Strategy Makers
Account Analysis 101
What Is Account Analysis and Why is it Important?
Account analysis is a part of financial statements analysis. It’s a process of checking and analyzing individual accounts to find errors, spot trends, and make informed decisions. An account is a category used to record financial transactions (more about that in the next chapters). Most often, each line item on a financial statement combines different accounts, but sometimes it can only be one. Here’s an example: the line COGS (cost of goods sold) on the income statement is a result of adding up the numbers for accounts for raw materials, labor, and manufacturing costs.
Usually, account analysis is done regularly. It’s either monthly, quarterly, or at the end of the fiscal year. It helps make sure that the financial records are accurate and up to date. It’s important to identify any discrepancies that could lead to reporting errors, and it helps keep compliance with financial regulations in check. It also provides insights for budgeting and forecasting.
If they catch mistakes early and keep their records accurate, businesses can maintain financial health and avoid errors that might prove expensive down the line.
Chart of Accounts (COA)
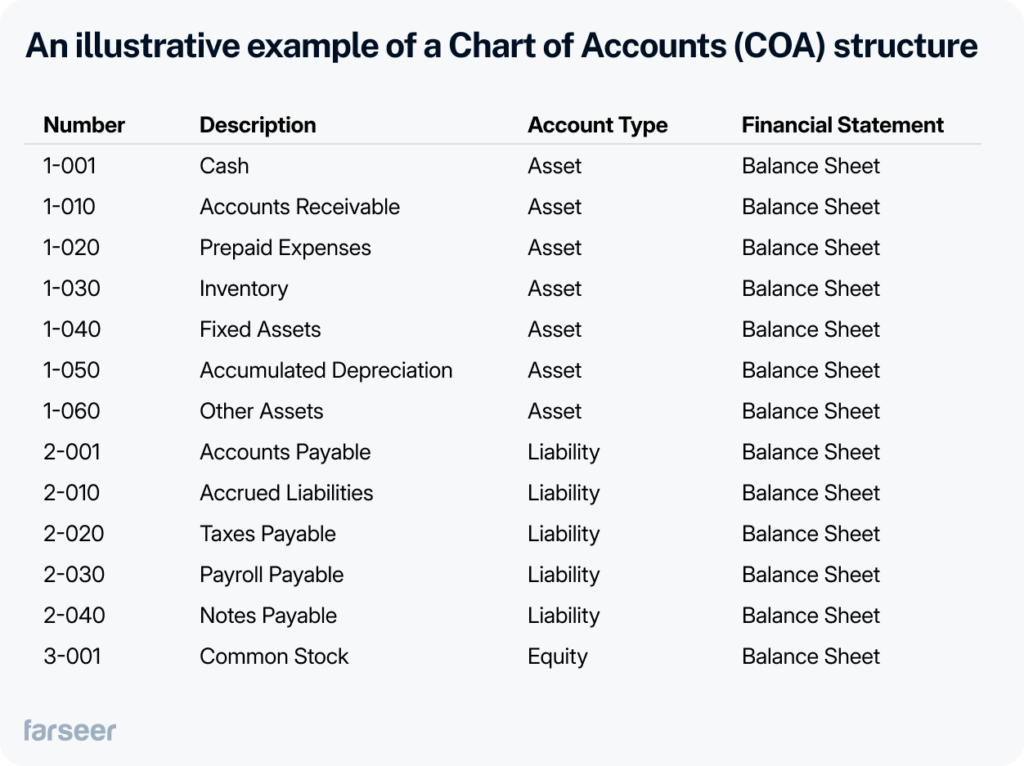
All companies organize their finances using a Chart of Accounts (COA), a master list that categorizes financial transactions into sections like revenue, expenses, liabilities and assets. This structure helps keep things organized, allowing analysts to easily investigate financial data. There are international standards like IFRS and GAAP that regulate COA structure, and many countries also have their own regulations. The goal is compliance and best practices. In account analysis, balance sheet accounts need extra attention because they carry over each year, and lousy maintenance can cause errors.

Key Accounts to Analyze
Let’s look into the most important accounts to analyze—revenue, expenses, liabilities, and assets.
Revenue Accounts
These accounts are usually in the 4000 range. Sales revenue is typically marked 4000, service income 4100, etc. They track the income streams of your company, or in other words, they track revenue from all your sales and services. Analyzing these accounts helps you to discover trends that are crucial for planning and forecasting—sales spikes during the holidays, declines in sales during other periods, or any other patterns that might prove important.
When analyzing these accounts, it’s important to note their timing. For example, software companies charging for subscriptions will spread the income during the year differently than a retailer who records revenue at the point of sale. Retailers usually face more volatile revenue distribution because of seasonality, while software companies have steadier cash flows. This is crucial for when your revenue is reported, controlling your company’s cash flow and planning your strategy.
Expense Accounts
These accounts are in the 5000 range, and they track your business’s costs (e.g., COGS 5000, Salaries and Wages 5100). They help you see where your money is going and enable you to manage and control your expenses.
In this context, it’s important to differentiate between fixed costs like rent and insurance, and variable costs like raw materials and shipping. While it’s easier to plan for fixed costs, controlling variable costs is crucial, as they fluctuate with business activity and directly affect your profit margins.
Liabilities and Assets
Liabilities, usually in the 2000 range, and assets, in the 1000 range, track what the company owes and owns. Tracking liabilities like Accounts Payable and Loans is important for debt management and repayment schedules. It’s simple: if liabilities grow too fast, it often means financial trouble.
Analyzing assets like Cash and Inventory helps you make sure you use your resources efficiently. Underperforming assets will hurt your liquidity and operations.
It’s also important to review your depreciation, because it affects your asset values over time, and can significantly affect your reports’ accuracy.
How to Perform Account Analysis?
Gather the Right Financial Data
First, you’ll have to gather all financial data you need for the account analysis. Your sources will probably be trial balances, income statements and balance sheets. This data is the foundation of the entire analysis process, so make sure that the information you work with is complete, accurate, and up to date. Otherwise, your conclusions will be wrong.
Example: Companies like Unilever use ERP systems to collect and consolidate financial data from various divisions. They generate trial balances and financial reports across periods to analyze how they performed, making sure their data is accurate for decision-making.
Track Changes and Investigate What’s Behind the Numbers
Once you have all the data, you’ll want to compare account balances across all the different periods you have the data for (monthly, quarterly, or yearly). This way, you can identify trends, patterns, or unexpected fluctuations more easily.
If there are any discrepancies, use variance analysis to investigate them. If variances are significant, depending on the account, this can be an opportunity to optimize or signal potential problems.
Example: For instance, during a quarterly review an enterprise FMCG company might notice that their operating expenses spiked. After variance analysis, they realize that the transportation costs increased. This makes them reconsider their logistics strategy. They negotiate better rates with suppliers and as result, they mitigate rising costs and improve their supply chain efficiency.
Fine-Tune Your Budget and Improve Forecasts
After analyzing account trends and variances, the next logical step is to apply what you’ve learned to monitor your budgets and optimize forecasting. Comparing actual performance against your budgets helps you spot areas for optimization. Also, when you find consistent patterns in revenue or expense accounts, you’ll be able to use that to improve your forecasting.
Related: Budgeting vs Forecasting – Key Differences and When to Use Each?
Example: The FMCG company from the previous example might see a steady rise in transportation costs over several quarters. That might make them change and adjust their budget accordingly, and forecast future costs more accurately.
Account Analysis vs. Other Financial Analysis Methods
Account analysis digs deep into specific accounts to spot trends or issues, but it works best with other methods like horizontal and vertical analysis.
Horizontal vs. Account Analysis
Horizontal analysis compares full financial statements across multiple periods. It tracks trends such as revenue growth or cost increases. Account analysis, on the other hand, focuses on specific accounts (sales or expenses) to investigate how they perform in detail.
Vertical vs. Account Analysis
Vertical analysis looks at the proportion of items on a financial statement relative to a base, like the percentage of revenue spent on operating expenses. Account analysis tracks the performance of specific accounts over time, such as rent or salaries.
By combining horizontal and vertical analysis with account analysis, you get both a broad view of financial changes and a deeper, focused look at specific accounts that may require further investigation.
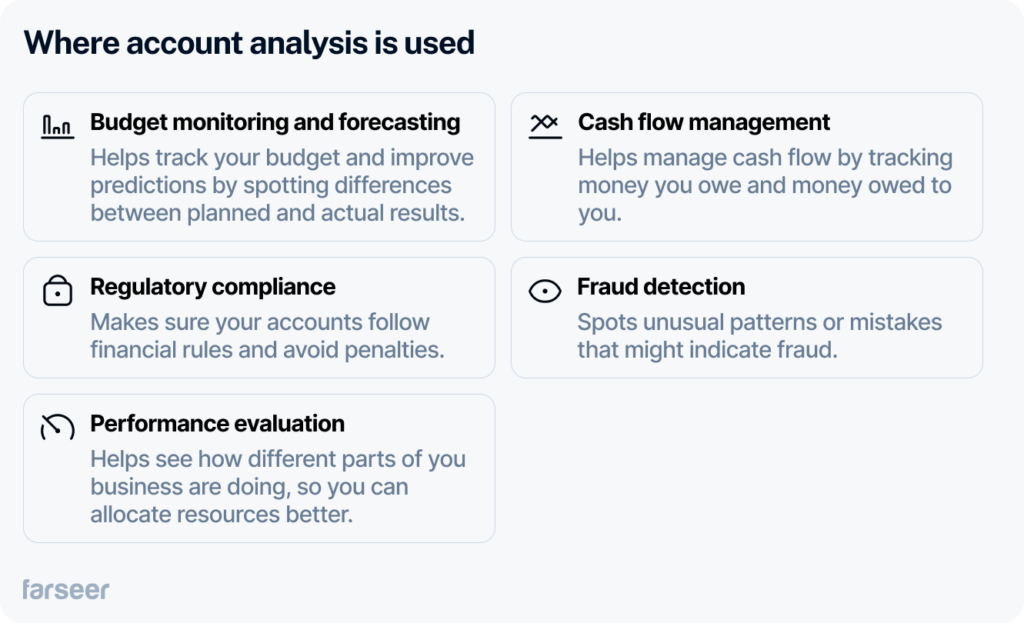
Where is Account Analysis Used?
In the image below, you can see the most common use cases of account analysis.

How Farseer Makes Account Analysis Easy
Let’s be honest, doing account analysis manually is a nightmare. It takes forever, and no matter how hard you try, mistakes and errors are inevitable. Farseer solves these problems. It automates data collection and centralizes all financial data across the three financial statements, so it’s always updated and ready. You can drill down from high-level financials to individual accounts without manual work. With real-time insights and forecasting tools, Farseer makes it easier to track trends, manage budgets, and ensure compliance with financial regulations.
If you want to find out more about Farseer, click below:
Conclusion
Account analysis is a powerful tool for maintaining the financial health of your business.
By regularly analyzing key accounts you can spot trends, control costs, and ensure compliance.
We’ve covered the most important aspects of account analysis, from gathering the right data and tracking changes to using tools like Farseer to make the process simple.
When automated, account analysis becomes faster, more accurate, and far less manual, empowering your business to focus on strategic decisions rather than administrative tasks.


