How to Build an Annual Operating Plan (AOP): A Step-by-Step Guide for FP&A Teams

Every FP&A professional knows this feeling. It is August. Someone from leadership mentions “AOP kickoff” in a meeting. And suddenly your calendar for the next three months looks very different.
The Annual Operating Plan is the biggest project most FP&A teams run all year. It is also the most misunderstood. People outside finance think it is a spreadsheet exercise. Fill in some numbers, add them up, done.
Read more: Strategic Financial Planning That Actually Drives Results
You know better. A good AOP is not just a spreadsheet with next year’s numbers. It is the document that turns your company’s long-term vision into a practical financial plan for the coming year. It aligns sales, marketing, operations, technology, and leadership around the same targets, the same assumptions, and the same priorities.
Done well, it gives management a clear view of expected revenue, costs, investments, risks, and profitability. Done badly, it becomes three months of chasing spreadsheets, arguing about formats, and explaining numbers nobody believes.
This article walks through the full AOP cycle step by step.
How to plan it, how to run it, how to consolidate it, and how to get it approved. Along the way, I will show how the key steps look inside a modern FP&A platform, so you can see the difference between doing this manually and doing it with proper tools.
What Is an Annual Operating Plan (AOP)?
An Annual Operating Plan is a financial projection for the next financial year. It translates the company’s three-year or five-year ambition into an annual P&L projection and the supporting plans behind it.
Different companies call it different things. Budget. Commitment. Target. Plan. The label changes, but the purpose stays the same.
Leadership has a vision. For example: Enter two new markets. Double revenue in five years. Improve margins by three percent. Grow headcount to a thousand people. The AOP asks the practical questions behind that vision:
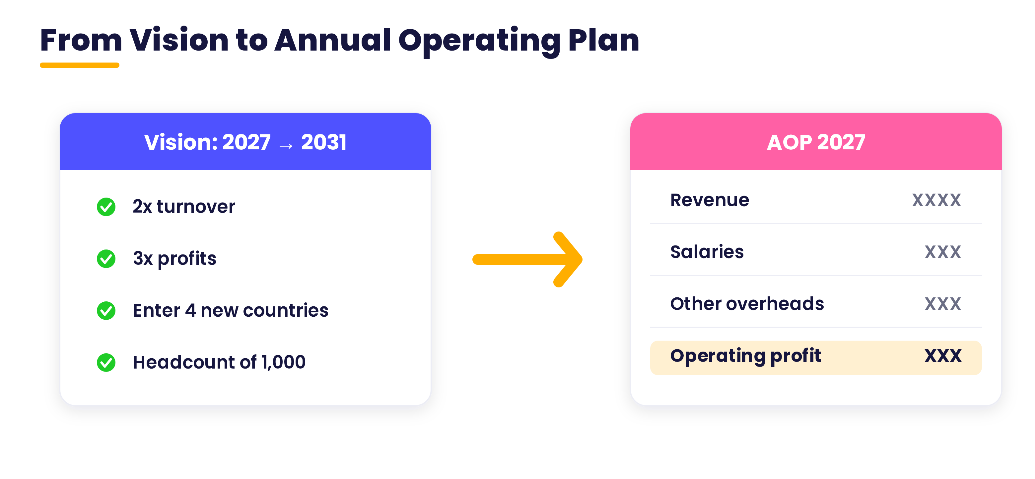
- What revenue do we expect next year?
- What resources do we need to achieve it?
- What will marketing, staffing, production, and administration cost?
- When will revenue and expenses actually land during the year?
- What capital investments are required?
- What level of profit or cash generation should we commit to?
Notice the phasing question in that list. A full-year number is not a plan. Leadership wants to know what happens in Q1 versus Q4, because cash, hiring, and investment decisions depend on timing.
One more thing worth noting. The AOP is not the same as your rolling forecast. The forecast is a living estimate that you update monthly or quarterly. The AOP is a commitment. It gets approved once, locked, and then used as the reference point for the entire year. Actuals get compared against it. Bonuses often depend on it. That is why it deserves more rigor than a regular forecast update.
And it runs in parallel with everything else. Month-end close does not pause for AOP season. Neither does management reporting, forecast updates, or business reviews. The AOP is an extra workstream on top of your normal rhythm, which is exactly why the process design matters so much.
Read: How to Accelerate Your Month-End Close: From Ten Days to Two Days
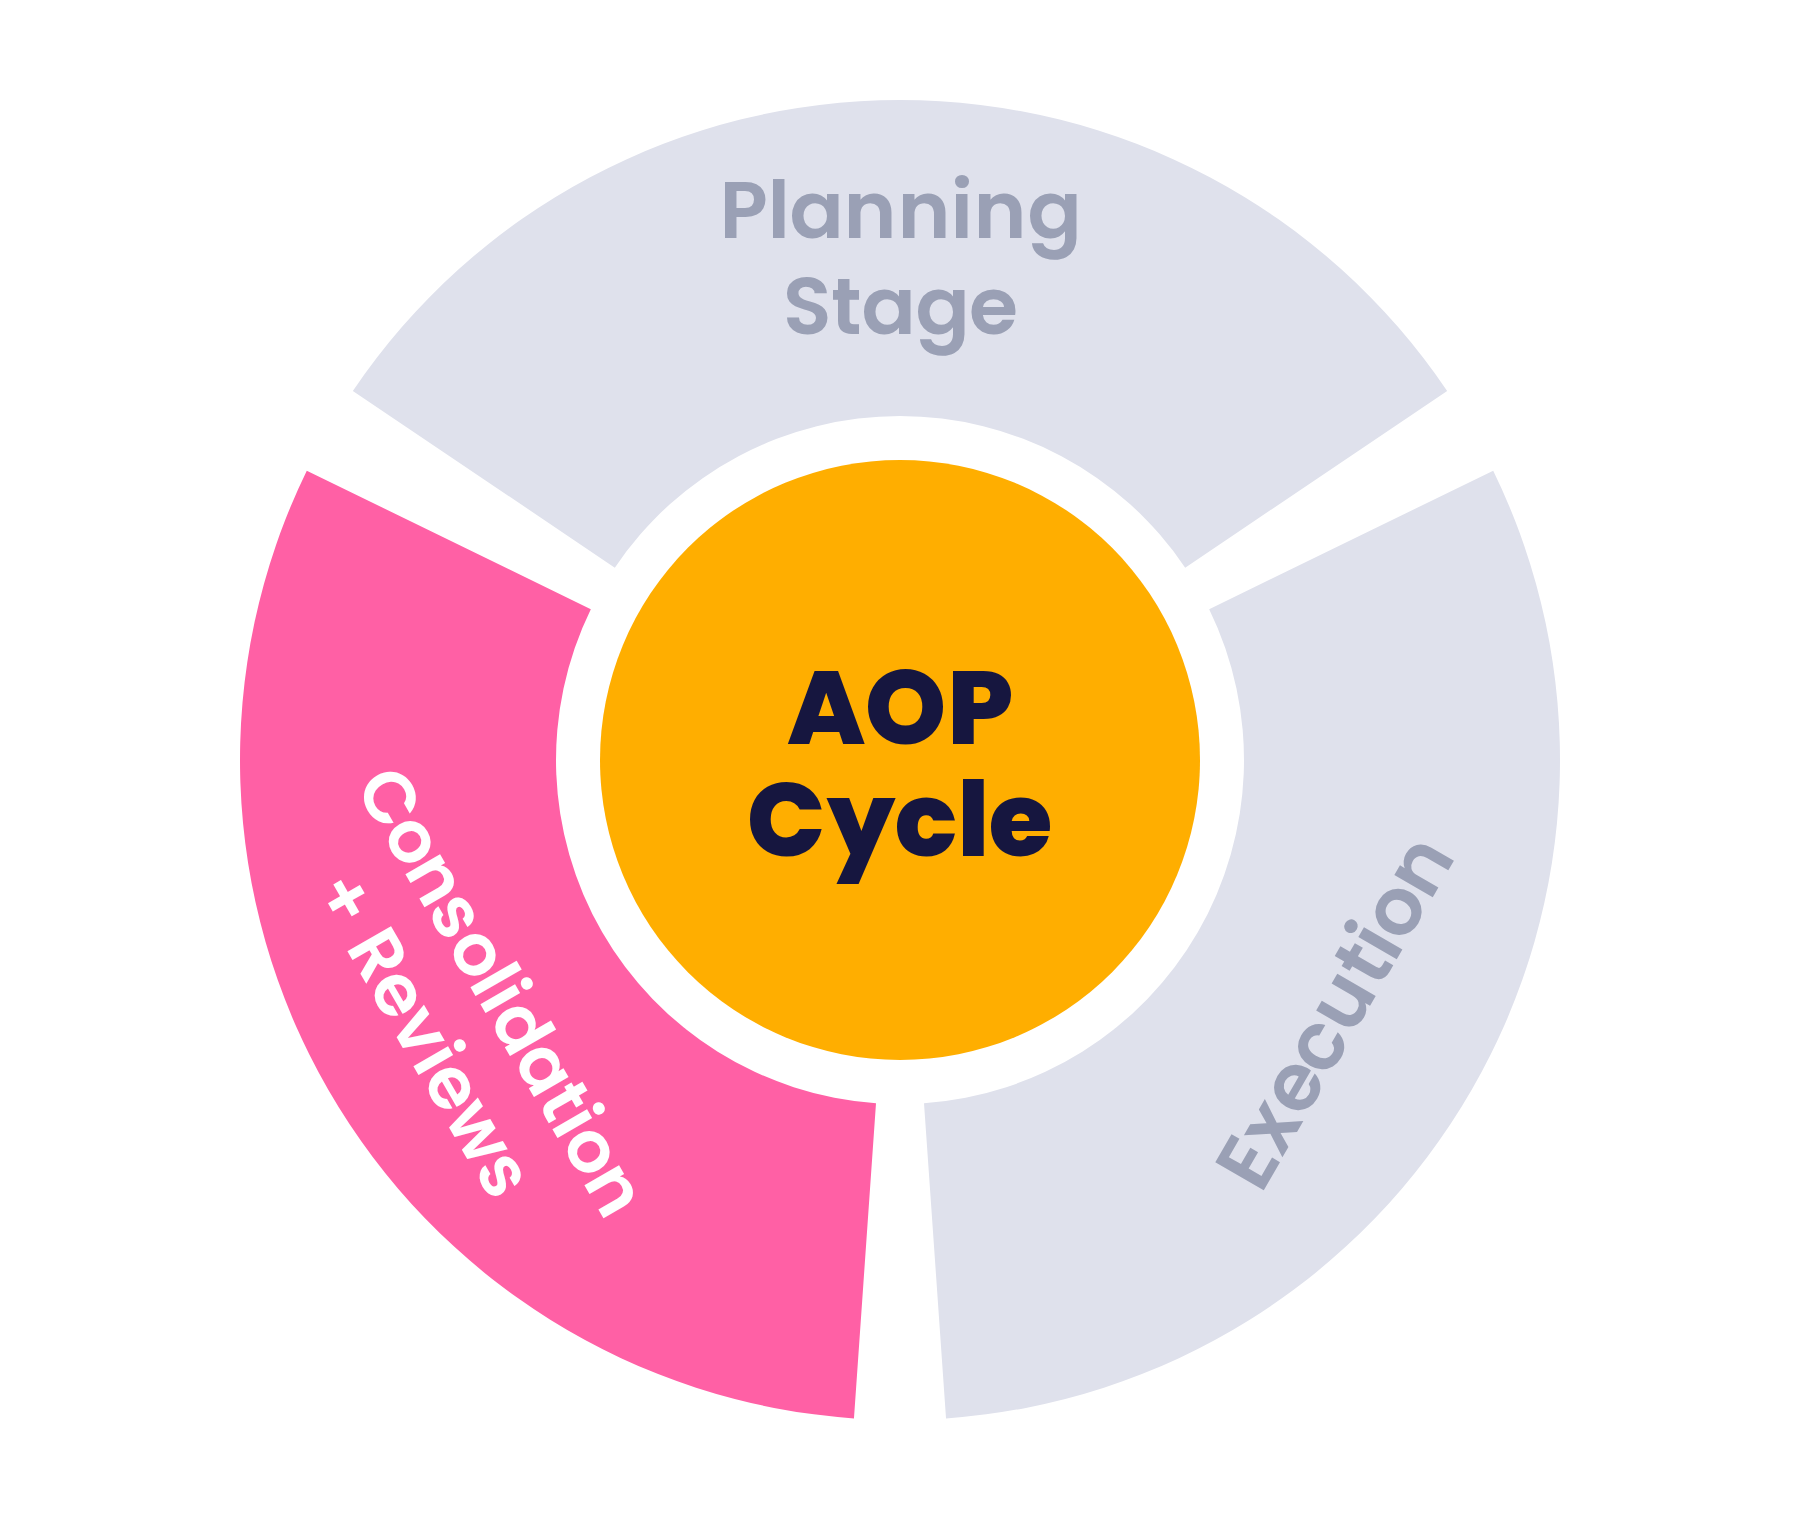
The Three Phases of the AOP Cycle
The annual cycle has three broad phases.
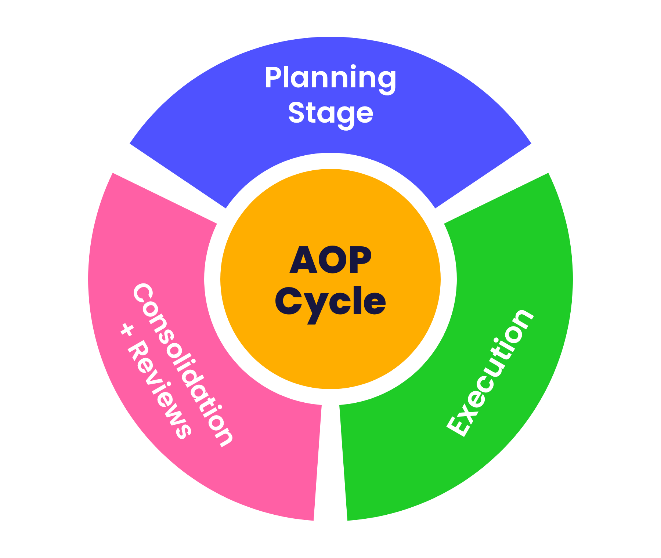
Phase 1 Planning: Define the rules, templates, responsibilities, and calendar.
Phase 2 Execution: Distribute templates, collect inputs, train teams, and monitor progress.
Phase 3 Consolidation and review: Combine department submissions, analyse movements, challenge assumptions, and get approval.
For a January to December financial year, this typically starts in August and runs through October or November. Most large organizations need two to three months for the full cycle.
The phases are not perfectly separate in practice. Planning may still be finishing while some teams have started entering data. Consolidation can begin while a few final submissions are trickling in. That is normal. What matters is that each phase gets done properly.
Let’s take them one at a time.
Phase 1: Plan the Process Before You Ask for a Single Number
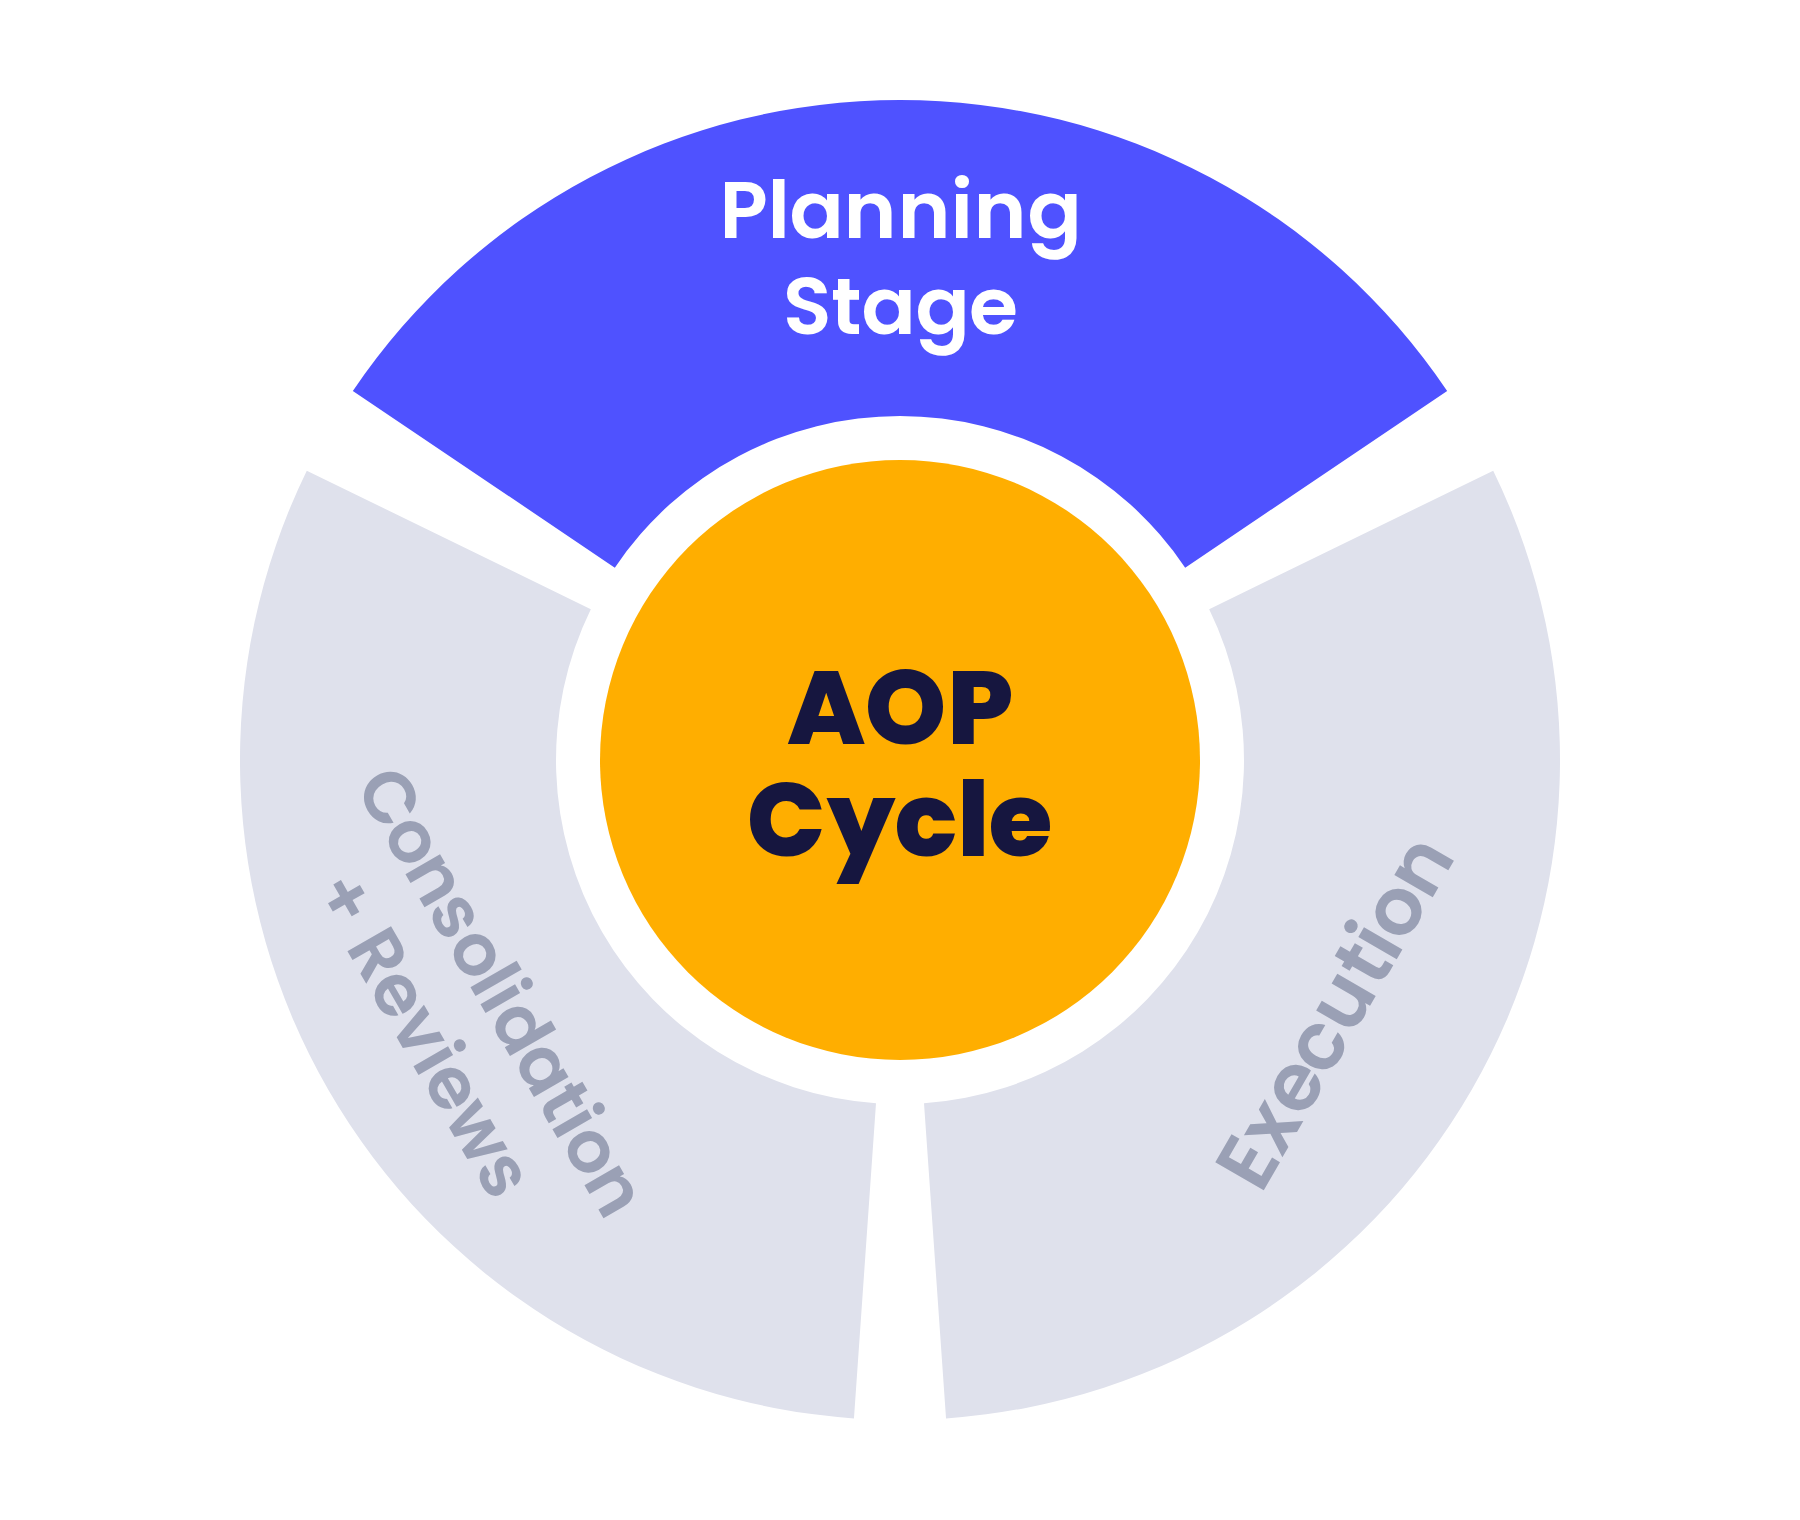
The most common AOP mistake happens before anyone opens a template. Teams skip the planning phase and jump straight to collecting numbers. Then they spend the next two months paying for it.
The planning phase has three jobs: Guidelines, Calendar, and Templates.
Step 1: Write clear AOP Guidelines
An AOP is collaborative. Business teams bring operational knowledge. Finance brings discipline, consistency, and challenge. Without shared rules, every department submits in a different format, uses different assumptions, and revises numbers whenever they feel like it.
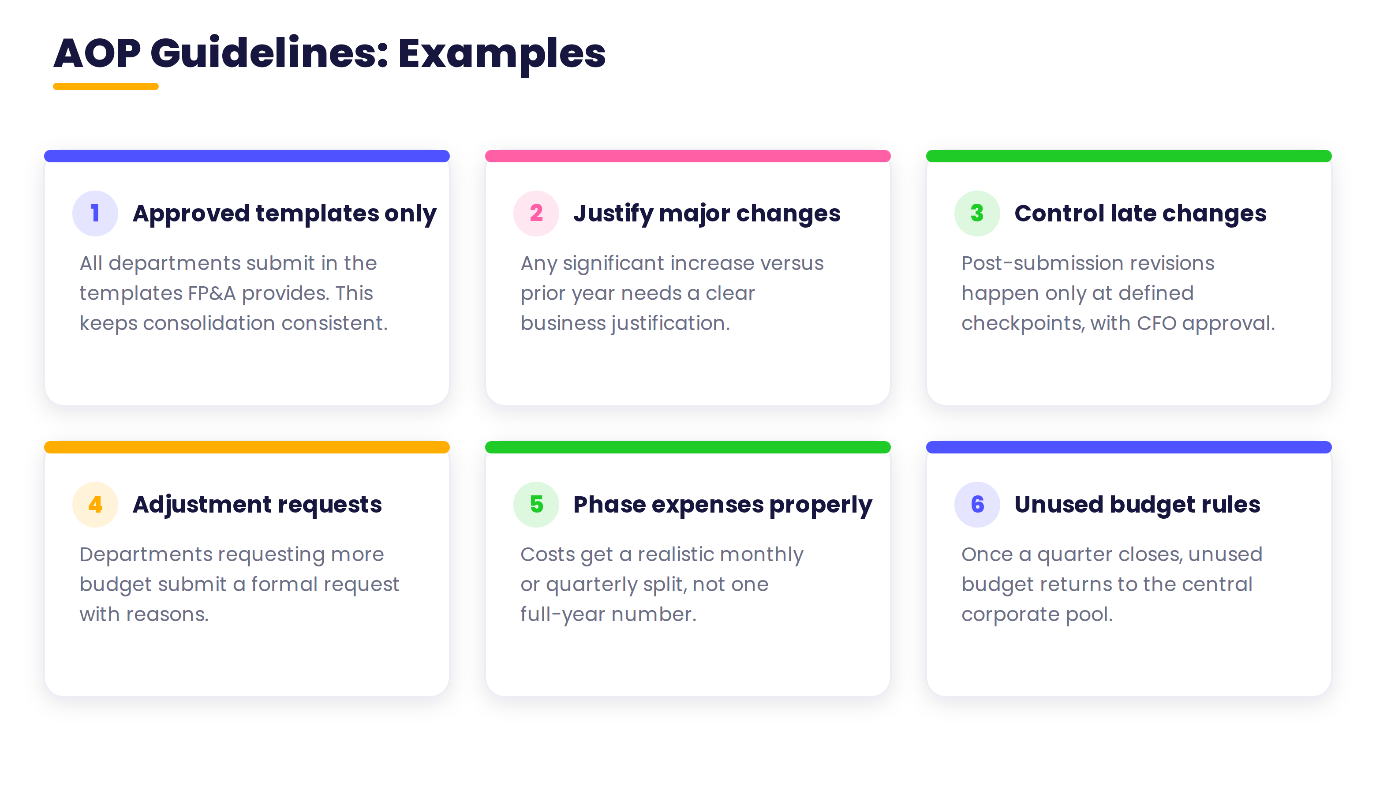
Guidelines set expectations from day one. The ones I have seen work best:
- Approved templates only: Departments submit in the template or planning system that FP&A provides. This is what makes consolidation possible.
- Explain major changes: A cost increase beyond inflation or volume growth needs a business justification. Not vague theories. An actual reason.
- Control post-submission changes: Revisions happen, but at defined checkpoints with the right approval. Not through a Tuesday night email with “final_v7” in the subject line.
- Require formal adjustment requests: If a department wants more money, they explain why.
- Phase expenses properly: A full-year number split evenly across twelve months is lazy and usually wrong. Costs need a realistic monthly or quarterly split.
- Define unused budget treatment: Decide upfront whether unspent quarterly funds carry forward or return to a central pool.
These rules are not bureaucracy. They exist because in November, someone in finance has to stand in front of the CFO and explain the final plan. Every shortcut taken in September becomes a question you cannot answer in November.
Step 2: Build the AOP calendar by working backward
Think about how people plan a wedding or a professional exam. Nobody starts on the day itself. There is preparation, revision, practice, and then execution. Your company’s AOP deserves the same discipline.
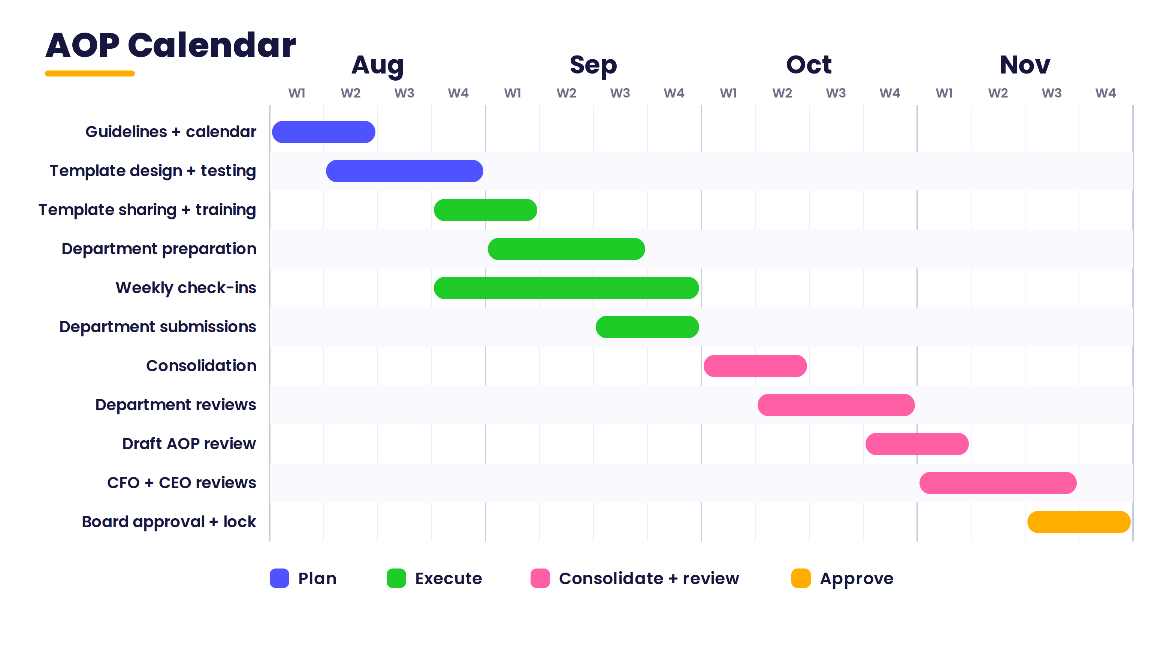
Start with the immovable date and work backward. Say the board reviews the plan on December 15:
- The CEO probably wants the consolidated plan by mid-November.
- The CFO needs internal reviews and consolidation done by October 30.
- Department submissions need to come back by end of September.
- Templates, training, and guidelines must all be ready before submissions begin.
That backward chain tells you when you need to start. Usually earlier than you think.
A realistic calendar also accounts for interruptions. A listed company might have an earnings review in late September. During that week, finance has almost no capacity for AOP work. Plan around it instead of pretending every day is available.
Two to three months sounds like a lot. It is not. The finance team is running close, reporting, and forecasting alongside the whole thing.
Read: FP&A Monthly Calendar
Step 3: Design and share driver-based templates.
The template is the operational backbone of the whole process. It needs to be detailed enough to capture real business drivers, but simple enough for a non-finance manager to complete accurately.
Take a manufacturing company selling ice cream through multiple channels. A sales template for that business might capture sales channel, product and flavour, customer name, historical volumes, prior-year pricing, discount levels, and monthly volume fields for the coming year. The template then calculates revenue from volume and price.
Two design principles matter here.
First, never send a blank page. Prepopulate prior-year volumes, revenue, pricing, and discounts. A sales manager makes far better judgments when last year’s numbers are sitting right there.
Second, let the template do the math. The manager enters volumes. The template calculates value. That is driver-based planning in its simplest form, and it keeps the logic consistent across every submission.
Read: Everything You Need to Know About Driver-Based Forecasting
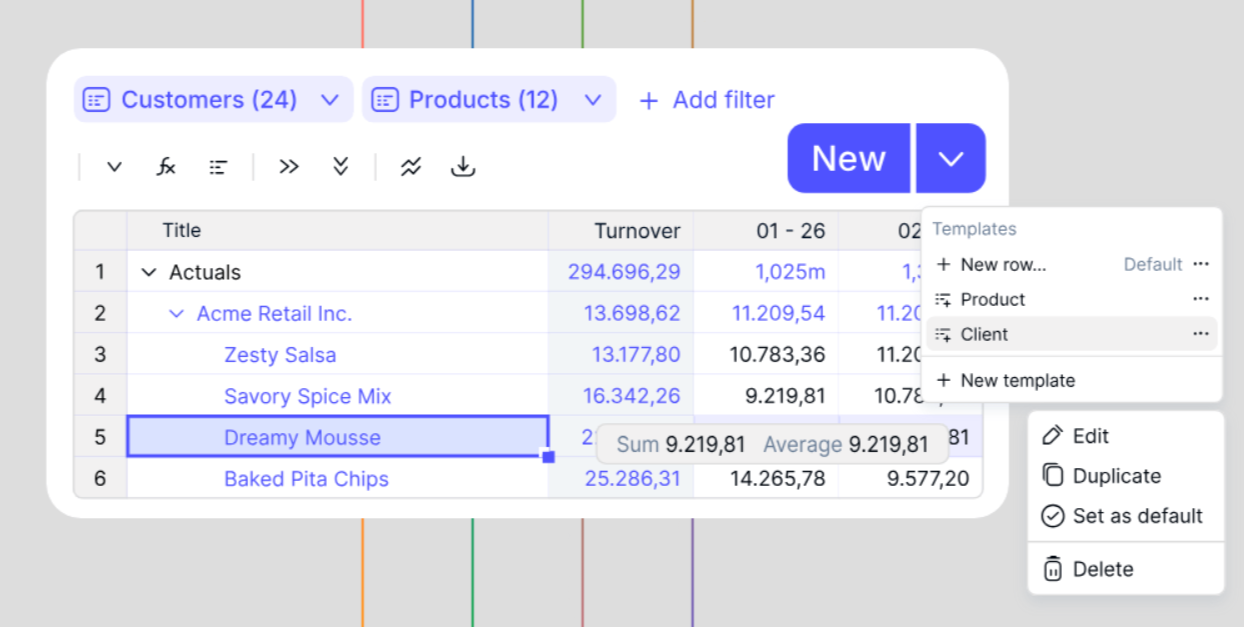
Now, here is where an FP&A tool can be a game changer. In Excel, you build this template once and then email twenty copies to twenty sales managers. Twenty files come back with broken formulas, renamed tabs, and hardcoded overrides. In a platform like Farseer, the template is not a file. It is a structured input form sitting on top of one central model. Every manager enters their volumes directly into the same system, the driver logic lives in one place, and nobody can accidentally break a formula or create a rogue version. You define the model once, and the structure holds for everyone.
Excel still dominates in mid-sized companies, and a hybrid approach works too. But the more mature setup gives departments direct access to the planning tool. Less manual consolidation. No version-control archaeology.
Read: From Excel to Connected Planning: A Practical Migration Strategy for Finance Teams
Phase 2: Execute Through Business Partnering
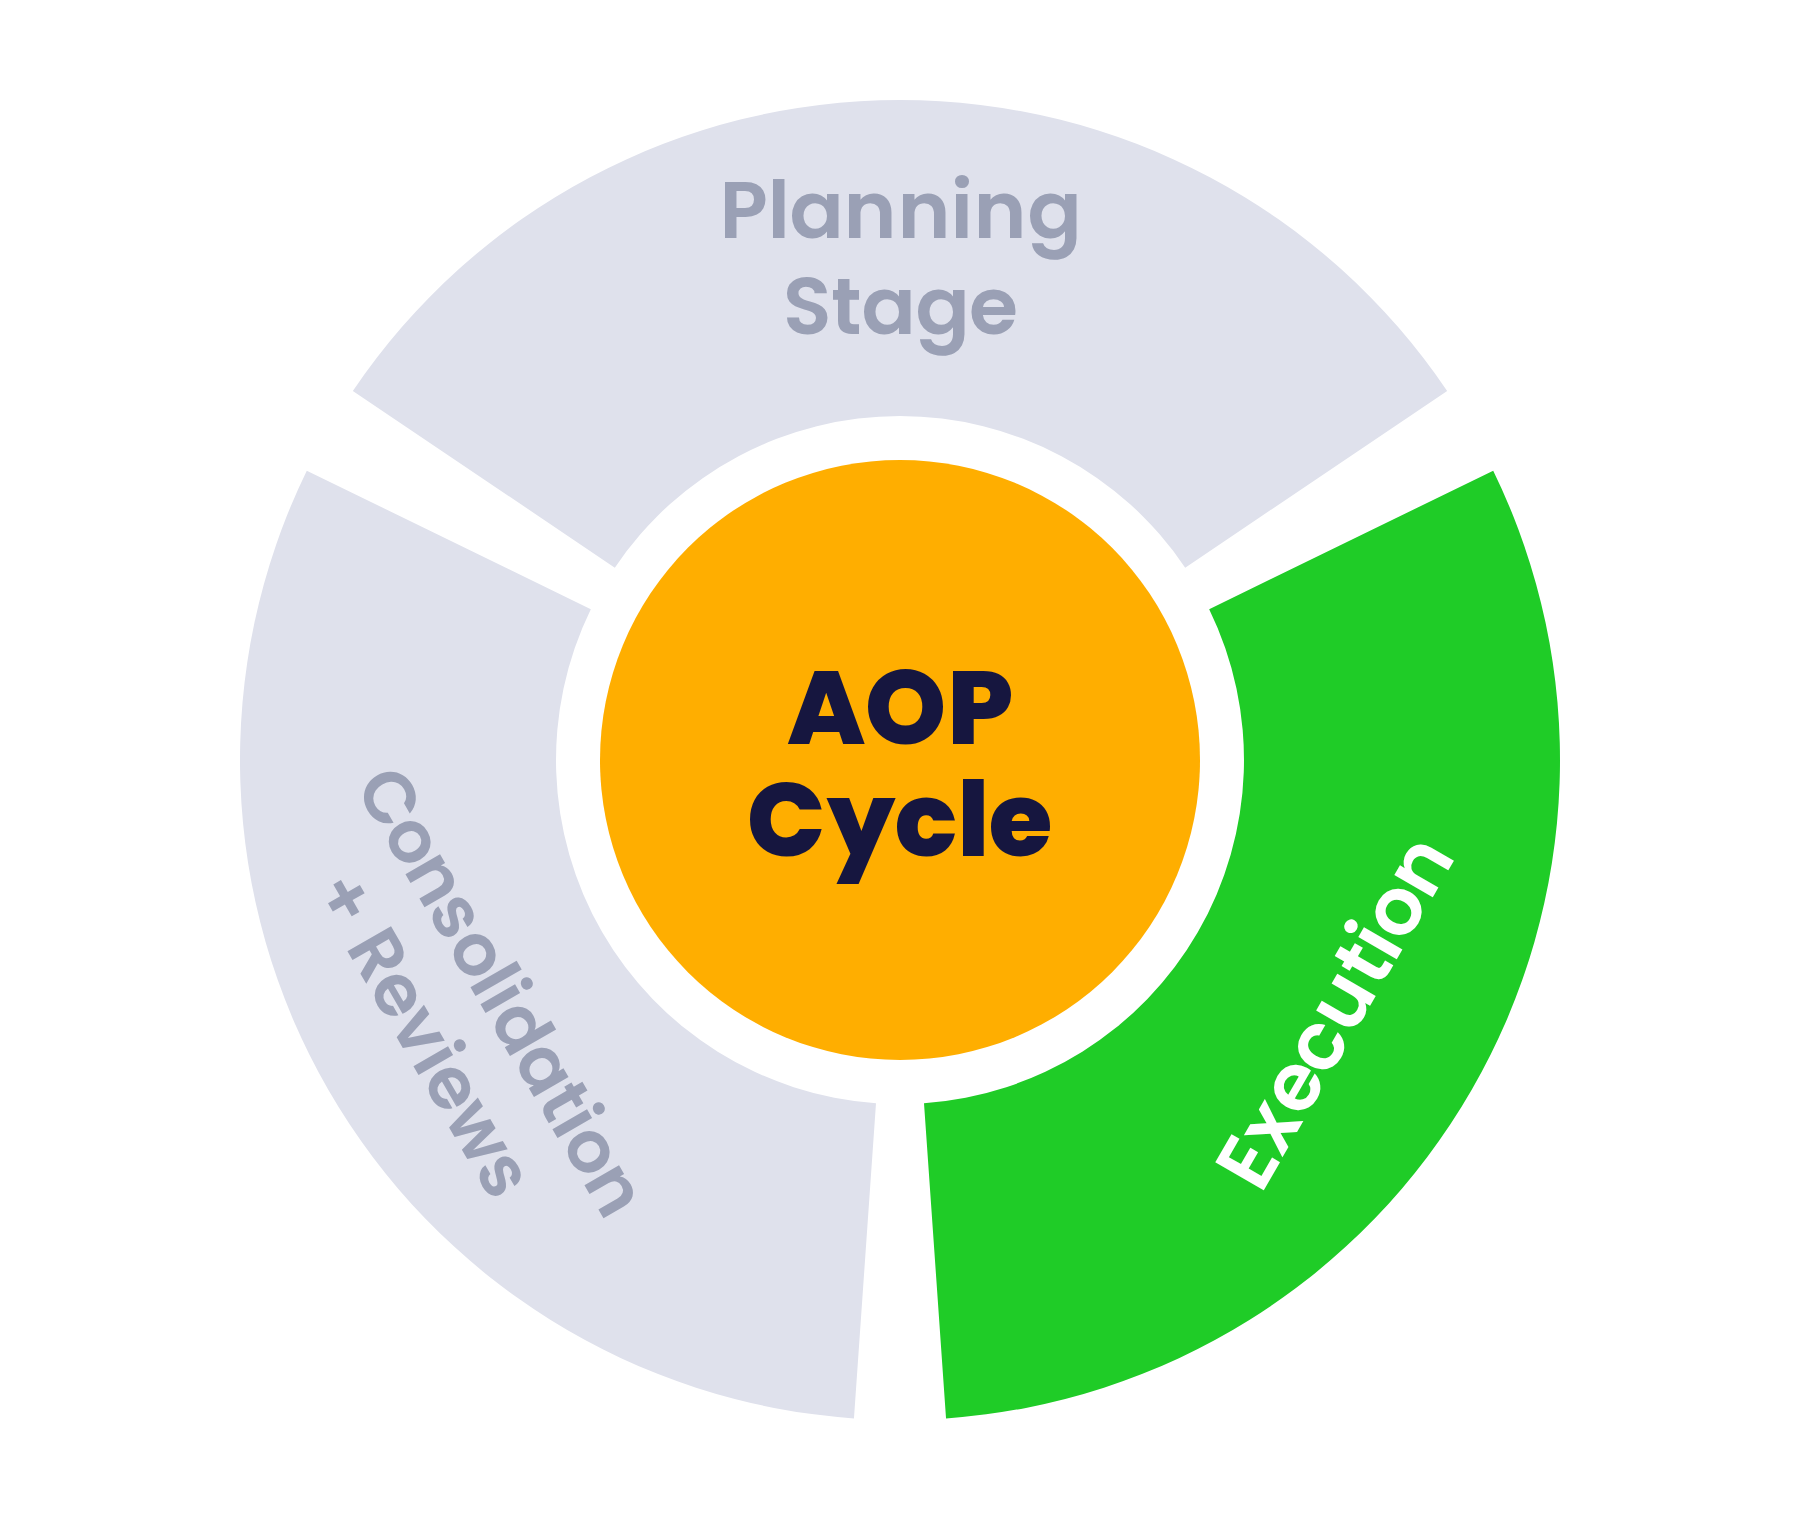
Templates are out. Now the real FP&A work starts. Sending files is not execution. Execution is active business partnering until every submission comes back complete and credible.
Step 4: Train stakeholders and communicate expectations
A department can understand its business perfectly and still struggle with your template. They may not know where to find the data, how to enter assumptions, or how phasing should work.
So, walk them through it. Before submissions start, FP&A should explain:
- What information is needed and which fields are mandatory.
- Which data is prepopulated and should not be touched.
- What assumptions are expected.
- How revenue and expense phasing should work.
- When submissions are due.
- How questions and revisions will be handled.
One training session in early September saves dozens of correction emails in October. This is not optional admin. It is the highest-leverage hour of the whole cycle.
Step 5: Collect operational inputs
Here is the difference between a plan and a guess. A sales manager who takes last year’s total and adds 10% is guessing. A sales manager who builds the number from operational reality is planning.
Back to the ice cream company. A manager responsible for a big account like KFC should be reviewing historical order patterns. If an account had zero orders last year because the store was under renovation, the manager needs to talk to the customer. When does the store reopen? What volume do they expect from that point?
For an existing account, the manager might learn that current order levels hold through Q1, but the customer plans to expand its store footprint from April. That has a direct impact on projected volumes. The AOP then reflects specific customer intelligence, not a blanket percentage.
In other businesses the drivers differ. SaaS companies build revenue from pipeline, conversion rates, and deal timing. Retailers build from stores and footfall. The principle is the same everywhere: use the best available business evidence.
Your job in FP&A is to ask for that evidence. “Where does this number come from?” is the most useful question you will ask all season.
Step 6: Run weekly progress check-ins.
The classic failure: send templates on September 1, set a September 30 deadline, send one reminder on September 29. Then act surprised when half the submissions are missing or half-baked.
Create recurring checkpoints instead. If twenty teams need to submit:
- End of week one: how many have started?
- End of week two: who is behind?
- Every week: what is blocking progress? Missing data, unclear instructions, access problems, competing priorities?
- Before the deadline: offer help, clarification, or extra training. Not after.
Regular communication is part of the process, not an optional extra. Deadlines fail silently. Check-ins fail loudly, early, when you can still fix things.
Read: How to Build a P&L Dashboard in Farseer (Step-by-Step)
This is also where a planning platform quietly earns its value. In a spreadsheet-based process, “who has submitted?” means opening twenty files or maintaining a manual tracker. In Farseer, you can see submission status across all departments in real time. Who has started, who has finished, whose numbers moved since last week. Chasing gets replaced by monitoring, and your weekly check-in becomes a five-minute status review instead of a detective exercise.
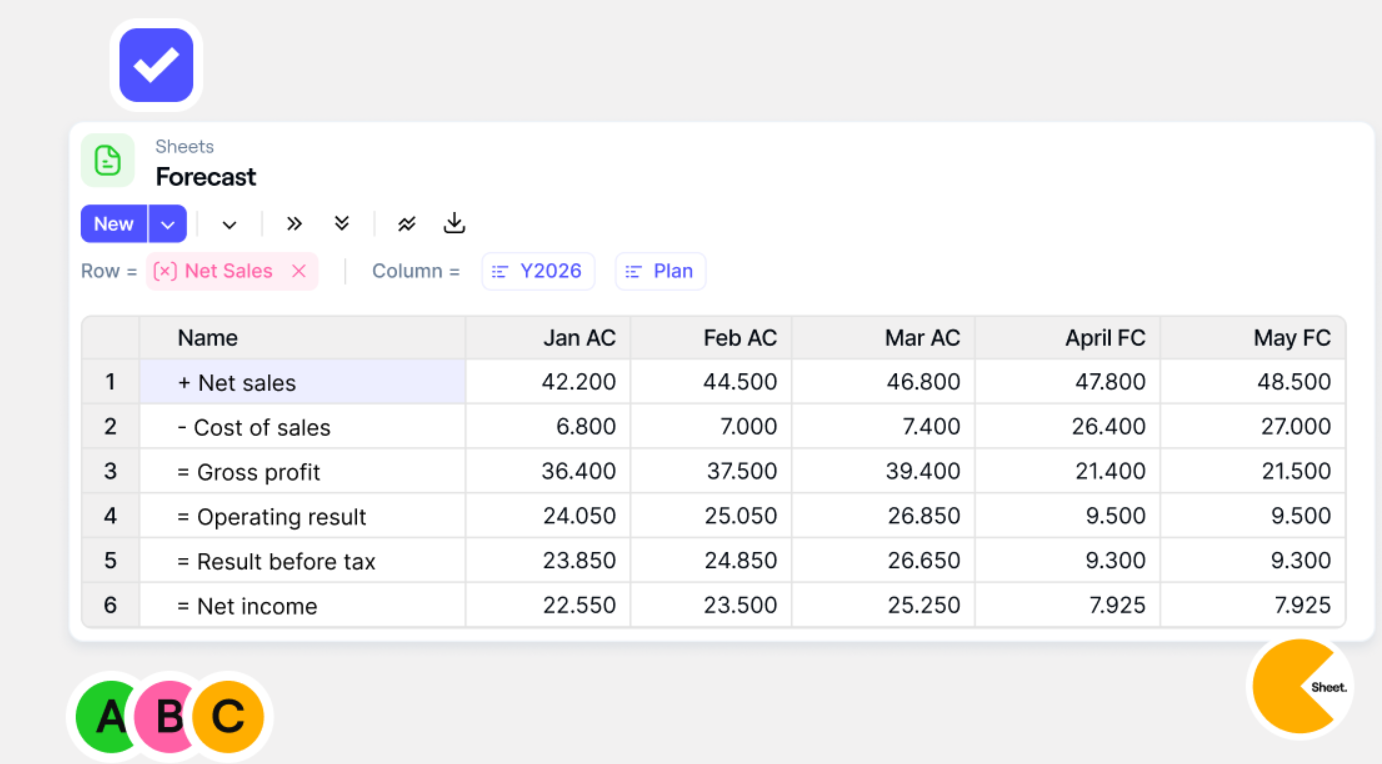
By the end of execution, finance should hold a complete set of credible submissions. Then the hardest phase begins.
Phase 3: Consolidate, Challenge, Review and Approve
Everything so far was preparation for this. Consolidation is where FP&A either adds real value or just adds numbers.
Step 7: Consolidate into one company view
Once department submissions are in, FP&A combines them into a company-level plan. Twenty sales submissions become one revenue line. Department cost plans roll up into total operating expenses. The output is a full P&L for the coming year, phased by month or quarter.
If you are doing this in Excel, this is the scary part. Linking twenty workbooks. Checking that every tab structure matches. Finding the one submission where someone inserted a row and broke everything downstream.
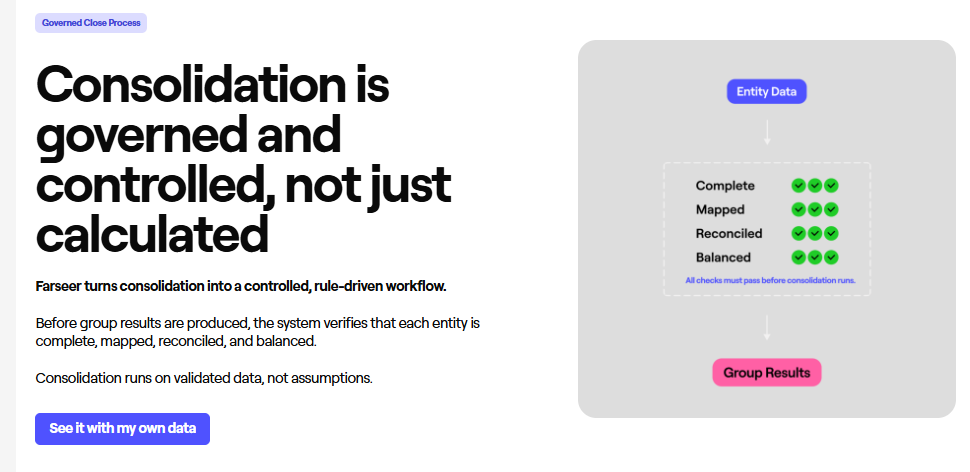
This is the third place where an FP&A tool makes a difference. In Farseer, consolidation is not a task. It is a property of the model. Because every department entered data into the same central structure, the company-level view exists the moment the last submission lands. Change one department’s number and the group P&L updates instantly. No linking, no copy-paste, no reconciliation step. The hours you used to spend assembling the plan go into analysing it instead.
However you consolidate, remember what consolidation actually is. It is not just adding numbers together. It is understanding the story behind every major movement before anyone senior sees the total.
Step 8: Review variances with detail and context
Compare the submitted plan against prior-year actuals, prior-year budget, the current forecast, and any top-down targets. Every large movement needs an explanation before the numbers reach the CFO.
The questions are simple but non-negotiable:
- What changed versus last year?
- Why did it change?
- Is the assumption backed by operational reality?
- Has the department missed a recurring cost?
- Is the monthly phasing sensible?
- Does the bottom-up plan meet the company’s top-down ambition?
That last question is where most AOP cycles get tense. Bottom-up almost never matches top-down on the first pass. Departments plan conservatively. Leadership plans ambitiously. Closing that gap through honest conversation, rather than arbitrary cuts, is where FP&A earns its seat.
Finance should also be proactive, not just critical. A business team might forget an expense from last year, like a recurring event that cost $50,000. FP&A can flag it, ask whether it repeats, and make sure the team includes it before finalizing.
This is the difference between collecting numbers and doing real FP&A work. When the CFO asks why marketing is up 18%, “that’s what they submitted” is not an answer. You should know the logic behind every material line.
Step 9: Expect multiple versions, and control them
No AOP survives first contact with leadership. Version one becomes version five as teams refine assumptions, leaders challenge plans, and trade-offs get made. That is healthy. What is not healthy is losing track of which version is which.
Version control matters because the final approved plan must be clearly identified and locked. In Excel, this is where “AOP_v21_final_FINAL_approved(2).xlsx” is born. In a proper planning tool like Farseer, versions are managed as scenarios instead. You hold the top-down target, the bottom-up submission, and each review iteration as separate versions of the same model, compare them side by side, and lock the approved one when the board signs off. When someone asks in March what changed between the CFO draft and the board version, the answer takes seconds, not an afternoon.
Step 10: Get approval and lock the plan
The typical approval path runs from department consolidation through FP&A review, then business review, then CFO, then CEO, then board. Once the board approves, the AOP becomes the official reference point for the year.
Lock it. All future forecasts, variance analysis, and performance conversations compare against this approved version.
What Goes into a Complete AOP?
The full plan mirrors the structure of the income statement, plus key balance sheet items. Depending on your business, that typically means:
- Revenue plan: sales by customer, product, channel, or geography
- Production plan: output requirements driven by the sales plan
- Inventory plan: stock needed to support sales and production
- COGS plan: direct materials, direct labour, and manufacturing overhead
- Marketing and sales plan: campaigns, trade spend, and sales support
- Headcount and salary plan: existing workforce, new hires, and total employee cost
- Administrative plan: corporate and general operating expenses
- R&D plan: investment in product and technology
- Capex plan: equipment, facilities, and systems
In a large organization, ownership of these pieces is split. One FP&A analyst may own only travel and events. Another owns sales planning. Someone else runs headcount. That division is normal. It reflects the level of detail a quality plan requires. A multi-billion-dollar company can justify several people on a single cost category because the stakes are big enough.
If you are early in your FP&A career and only see one slice of the AOP, do not worry. Owning one piece well is exactly how you learn the whole.
The Skills That Make AOP Season Easier
Running a good AOP cycle takes more than financial knowledge. The skill set CFOs increasingly look for:
- Core FP&A concepts: budgeting, forecasting, variance analysis, profitability analysis.
- Financial Modelling: reliable driver-based models and templates
- Data Storytelling: explaining what the numbers mean, not just presenting them
- Business Partnering: working with operational leaders and challenging assumptions without burning relationships
- Tool Fluency: knowing your way around modern planning platforms and using AI to automate the repetitive parts
That last one is becoming a genuine differentiator. The analyst who spends October reconciling spreadsheet versions and the analyst who spends October pressure-testing assumptions are not doing the same job. Only one of them is doing FP&A.
The 10-Step AOP Checklist
Here is the full cycle in one list you can pin above your desk in August:
The 10-Step AOP Checklist
- Develop AOP guidelines
- Build the calendar backward from board approval
- Design and share driver-based templates
- Train stakeholders and communicate expectations
- Collect operational inputs
- Run weekly progress check-ins
- Consolidate department plans into one company view
- Review assumptions, prior-year movements, and variances
- Complete FP&A, business, CFO, and CEO reviews
- Get board approval and lock the final version
Simple to list. Hard to do well. The teams that struggle usually skipped steps 1 through 4 and went straight to collecting numbers.
Final Thought: An AOP Is a Business Conversation
The best annual plans are not produced by finance working alone, and they are not a stack of disconnected spreadsheets. They are structured conversations between business leaders and FP&A. Clear guidelines, practical templates, realistic timelines, regular follow-up, and rigorous review.
When those pieces are in place, the AOP becomes more than a target. It becomes a disciplined statement of how the company intends to grow, invest, manage risk, and deliver results in the year ahead.
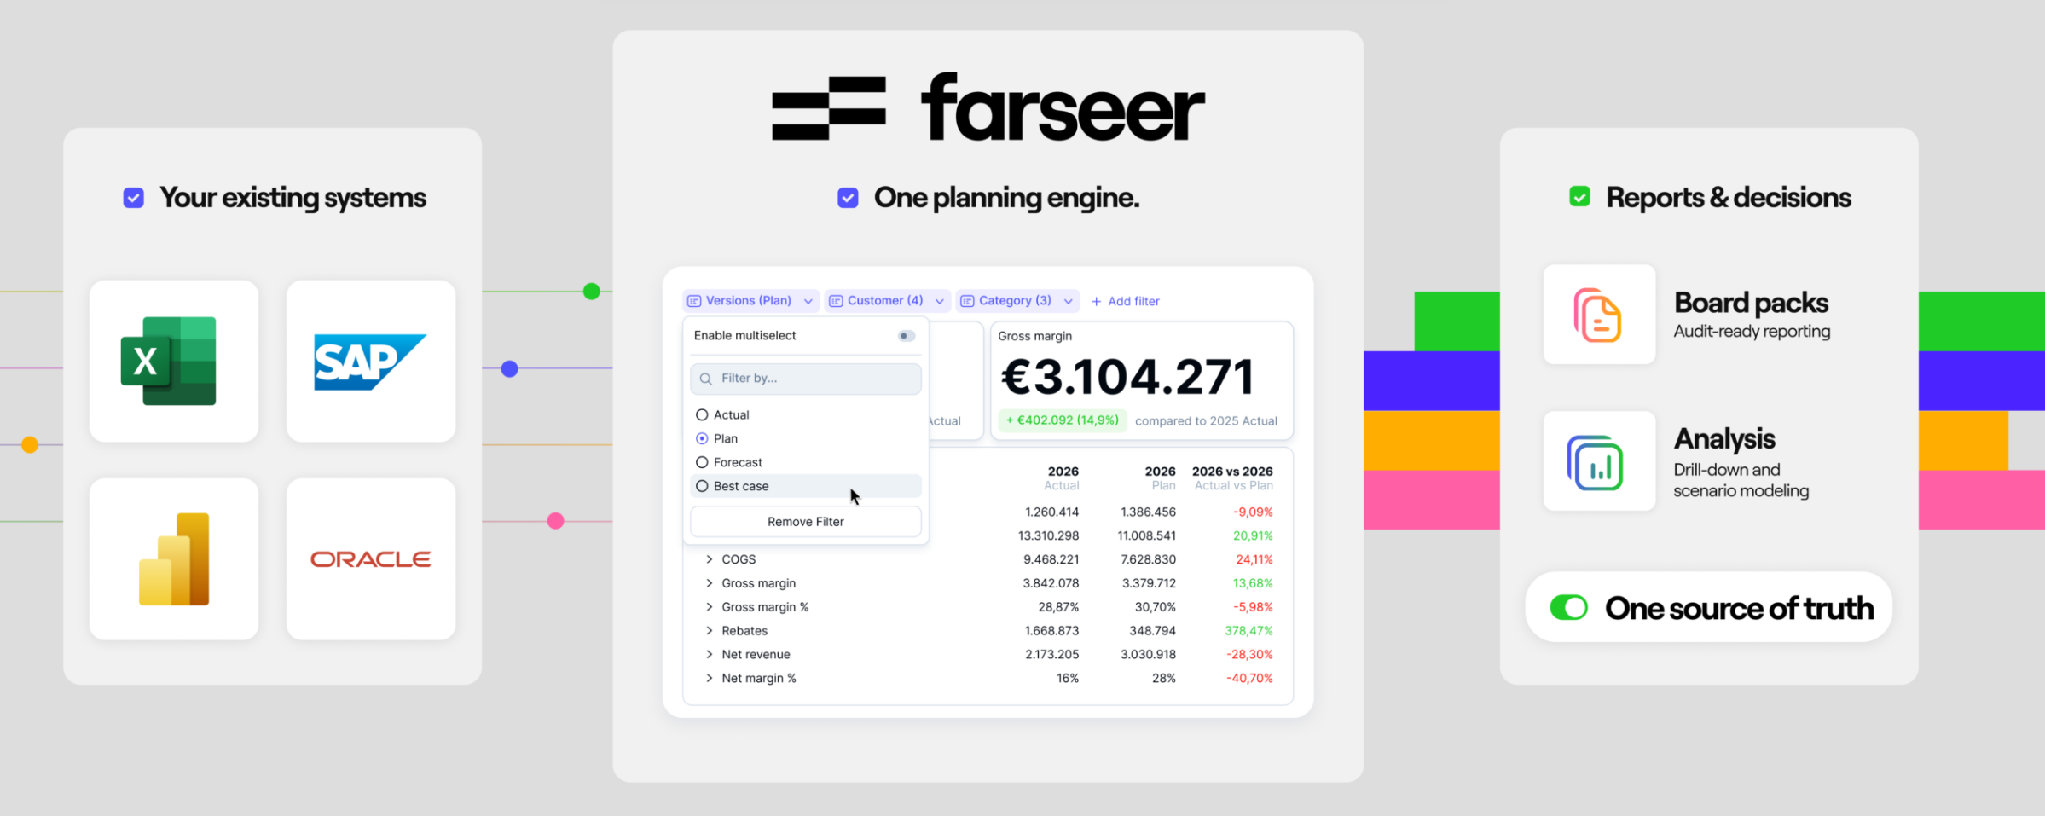
The process matters more than the tool. But the tool decides how much of your time goes to mechanics versus thinking. If your team still loses weeks each year to version chaos and manual consolidation, it is worth seeing how a platform like Farseer handles the same cycle. The plan does not get easier. The plumbing does.
So, before the next cycle kicks off, ask yourself one question. Is your AOP process deliberately designed, or does it just happen? The answer usually explains everything about how November feels.
Start your next cycle prepared. Download the AOP Planning Calendar & Checklist and walk into August with the calendar built and every step mapped.
Download free:

FAQ
What is an Annual Operating Plan (AOP)?
An Annual Operating Plan (AOP) is a detailed financial and operational plan for the coming fiscal year. It translates a company’s long-term strategy into specific revenue targets, expense budgets, headcount plans, capital investments, operational assumptions, and profitability goals. Once approved, the AOP typically becomes the baseline against which actual performance is measured throughout the year.
What is the difference between an AOP and a budget?
The terms AOP and budget are often used interchangeably, but an Annual Operating Plan can be broader than the financial budget alone. The budget focuses primarily on financial targets and resource allocation, while the AOP connects those numbers to the operational assumptions, business drivers, initiatives, and departmental plans required to achieve them.
What is the difference between an AOP and a rolling forecast?
An AOP is generally approved and locked before or near the beginning of the financial year and serves as the company’s performance baseline. A rolling forecast is updated periodically throughout the year using actual results and the latest business assumptions. The AOP answers, “What did we commit to?” while the forecast answers, “Where do we now expect to land?”
What are the main components of an Annual Operating Plan?
A complete AOP typically includes a revenue plan, production and inventory plans where applicable, COGS, marketing and sales expenses, headcount and salaries, administrative expenses, R&D, capital expenditure, and other key balance sheet or cash flow assumptions. The exact components depend on the company’s industry, size, and business model.
What are the main steps in the AOP process?
A strong AOP process typically includes setting planning guidelines, building the AOP calendar, preparing templates, training stakeholders, collecting operational inputs, monitoring submissions, consolidating departmental plans, reviewing assumptions and variances, completing management reviews, and obtaining final approval before locking the plan.
How long does the Annual Operating Planning process take?
For many organizations, the AOP process takes approximately two to three months. A company operating on a January-to-December fiscal year may begin planning around August, collect departmental submissions during September, consolidate and review the plan during October and November, and obtain final leadership or board approval before year-end.
What is driver-based planning in an AOP?
Driver-based planning builds financial projections from the operational factors that actually create business performance. Instead of simply increasing last year’s revenue by a percentage, for example, a company might forecast revenue using customer volumes, pricing, conversion rates, store count, sales pipeline, or other measurable drivers. This makes assumptions easier to understand, challenge, and update.
How should FP&A teams manage AOP submissions from different departments?
FP&A should establish standardized templates, common assumptions, clear deadlines, defined ownership, and regular progress check-ins. Prepopulating historical information and allowing business teams to enter operational drivers rather than manipulate formulas can also improve submission quality and make consolidation significantly easier.
How should FP&A review and challenge an Annual Operating Plan?
FP&A should compare submissions against prior-year actuals, the previous budget, the latest forecast, and top-down management targets. Material movements should be supported by clear operational assumptions, and finance should challenge unusual growth rates, missing recurring costs, unrealistic monthly phasing, and gaps between bottom-up submissions and leadership expectations.
What are the most common AOP mistakes?
Common AOP mistakes include starting without clear guidelines, using overly complicated templates, relying on blanket percentage increases instead of business drivers, unrealistic monthly phasing, waiting until the submission deadline to identify problems, weak version control, and spending so much time consolidating spreadsheets that FP&A has too little time left to challenge the assumptions.

Budget Forecasting Methods: 6 Approaches Every CFO Should Know (And How to Choose)
Read more
Strategic Financial Planning That Actually Drives Results
Read more