Budget vs Actual in 2026: Examples, Formulas & How to Turn Variance Into Decisions

Let’s face it – there’s hardly a financial plan that survives first contact with reality. And budget vs actual is where those plans get tested in the real world. The whole story is actually really simple: compare what you had planned to spend or earn with what actually happened.
But the insights it provides? Can be game-changing. Especially for businesses in fast-moving industries like FMCG or manufacturing.
Related: Rolling Forecast – 101 Guide For Smarter Planning
A well-thought-through budget might set targets for marketing, production, or logistics, but unexpected shifts (like rising raw material costs or a sudden increase in demand) can quickly throw things off course.
In this blog, we’ll break down the why, what, and how of budget vs actual analysis and show how it can keep your financial goals aligned with the realities of running a business.
What Is Budget vs Actual? (Quick Definition)
Budget vs actual is a financial analysis method used to compare planned financial outcomes (budget) with real results (actuals) to identify variances and improve decision-making.
- Budget: what you planned
- Actual: what actually happened
- Variance: the difference between the two
Companies use this analysis to monitor performance, control costs, and adjust strategy as conditions change.

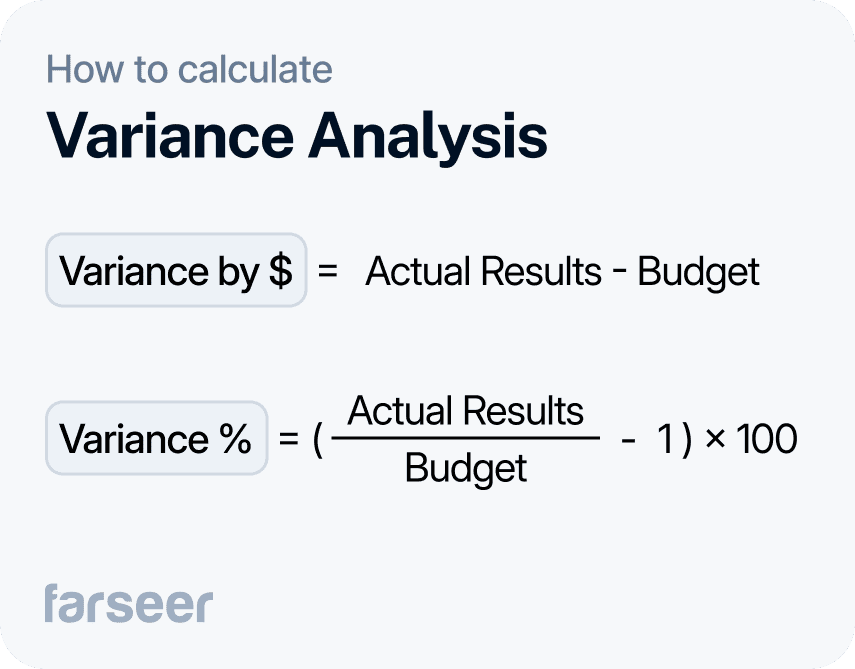
Budget vs Actual Formula
Understanding the math behind budget vs actual is simple — but powerful.
Variance ($):
Actual – Budget
Variance (%):
(Actual ÷ Budget – 1) × 100
Let’s look at an example:
- Budgeted revenue: €1,000,000
- Actual revenue: €900,000
- Variance: –€100,000
- Variance %: –10%
This means revenue is 10% below expectations — a signal that requires investigation and action.
Why Is Budget vs Actual Still a Thing in 2026
Cost Variance Example
A manufacturing company budgets €500,000 annually for raw materials.
Six months in:
- Supply chain disruptions increase prices
- Actual spend reaches €700,000
If the company identifies this late:
- Profit margins shrink
- Pricing adjustments are delayed
- Cash flow becomes constrained
But if detected early:
- Suppliers can be renegotiated
- Pricing strategies adjusted
- Production optimized
The key difference isn’t the variance itself — it’s how quickly you respond to it.
Key Components of Budget vs Actual Analysis
1. Revenue
Revenue variance is one of the clearest indicators of business performance.
- Below budget:
- weak demand
- pricing issues
- poor sales execution
- Above budget:
- unexpected growth
- under-forecasting
- new opportunities
Important: both scenarios require action — not just reporting.
2. Expenses: OPEX vs CAPEX
There are 2 types of expenses that you need to pay attention to:
Understanding cost variance requires separating expenses into categories.
These are day-to-day costs:
- salaries
- marketing
- utilities
- rent
Variance here often points to:
- inefficiencies
- uncontrolled spending
- operational issues
CAPEX (Capital Expenditures)
These are long-term investments:
- machinery
- software
- infrastructure
Variance may signal:
- project delays
- cost overruns
- strategic changes
3. Variance analysis
This is where the magic happens – comparing budgeted amounts with actuals to identify the why behind the numbers. Positive variances (actuals below budget) might look good but could signal missed opportunities, while negative variances (actuals above budget) often point to inefficiencies or failures in zero-based budgeting or unforeseen challenges.
Read: 5 Budget Forecasting Methods + Techniques to Improve Financial Planning
Tools and processes: moving beyond spreadsheet
While many companies rely on spreadsheets for budget vs actual analysis, this approach has serious challenges:
- Manual errors: A single formula error can lead to quite expensive mistakes.
- Time-intensive: Gathering data from multiple sources eats up valuable time.
- Lack of real-time updates: Spreadsheets can’t keep up with today’s dynamic business needs.
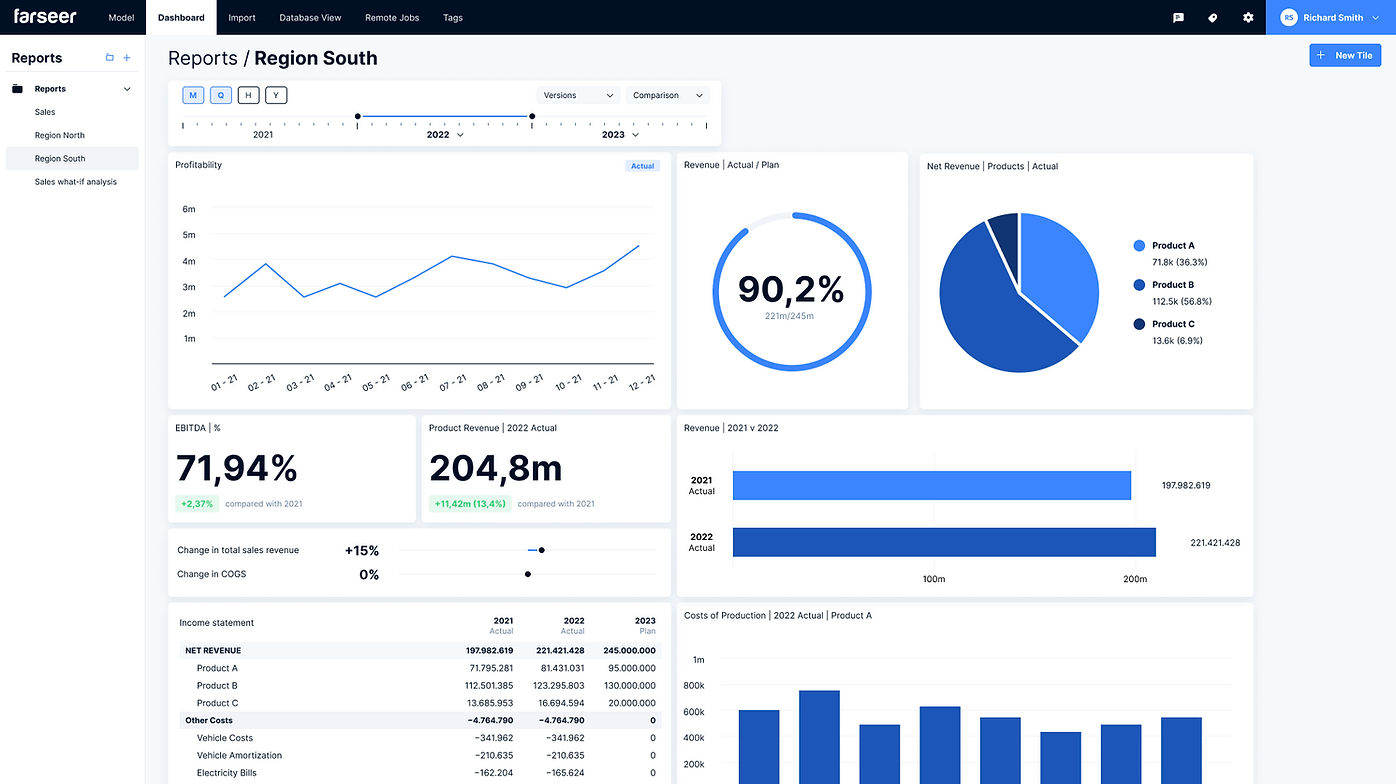
Modern FP&A tools like Farseer streamline the process, enabling real-time tracking, automated variance analysis, and integration with ERP systems. With features enhanced by AI in accounting, these tools reduce errors, improve accuracy, and free up your team to focus on strategy rather than struggling with data issues.
Pro tip: Since both budgets and actuals are usually tracked using the profit and loss (P&L) structure, having a clean, standardized template can make your life a lot easier.
If you don’t have a unified format yet, download our free P&L statement template here. It’s designed for enterprise planning and works seamlessly with actuals, budgets, and forecasts.
Best Practices for Effective Budget vs Actual Analysis
If you want to get the most out of budget vs actual analysis, you’ll need to go further from just analyzing numbers. It’s about adopting practices that ensure accuracy, efficiency, and useful insights. Here’s how to make your comparisons count:
1. Establish clear KPIs and benchmarks
First – you’d want to define what success means.
Setting specific Key Performance Indicators (KPIs) and benchmarks tailored to your business keeps everyone aligned. In this case, metrics like EBIT margin, cost-per-unit, or revenue-per-region provide clear goals and help identify variances that need attention.
For example, a manufacturing company might use cost-per-unit as a key benchmark. If the actual cost goes over the budgeted amount, they’d look into what’s causing it (maybe it’s production inefficiencies or rising raw material prices) so they can quickly make adjustments.
Read: Budgeting vs Forecasting – Key Differences and When to Use Each
2. Automate variance tracking with FP&A tools
Tracking variances manually often leads to delays and mistakes. This is where modern FP&A tools jump in.
They automate the whole process. And not just that. They offer real-time variance analysis, reduce the risk of errors, and they can instantly flag any deviations. This allows businesses to respond quickly and effectively to anything suspicious going on.
3. Collaborate across departments
Accurate budget vs actual analysis relies on input from different teams – sales, procurement, production, etc. Neglecting this collaboration may lead to incomplete or inaccurate data that can disrupt your numbers. Imagine you have a sales team that doesn’t communicate with finances or marketing! Sounds like a recipe for disaster.
Therefore, it’s important to build a culture of shared accountability. This will ultimately help ensure everyone provides timely and reliable information.
Read: Budget Management Software for Business: How to Finally Leave Excel Behind

Tools for Budget vs Actual Analysis
When it comes to Budget vs Actual analysis, the tools you use can be a huge game-changer. Many businesses still rely on spreadsheets, but nowadays these often cause more problems than help, especially in dynamic industries. Modern FP&A tools are the way to go here, with features that go far beyond manual systems.
Key features of FP&A tools
- Real-time reporting. FP&A tools provide real-time access to financial data. This allows businesses to track performance as it happens and it’s especially useful in dynamic industries like FMCG, where quick reactions can make a big difference.
- Automated variance tracking. Instead of manually calculating variances, FP&A tools automate the process. Alerts can be set up to notify teams of significant deviations, enabling faster corrective actions.
- Scenario planning. One of the most valuable features of modern tools is the ability to run scenarios. When you model potential outcomes based on different variables (e.g., changes in revenue or costs), businesses can make informed decisions even in uncertain conditions.
Read: 5 Best Financial Analysis Tools to Look Out For in 2026

Turning Budget vs Actual into a Strategic Advantage
Budget vs actual comparisons are not just your regular financial check. They keep your business aligned with its goals. Spotting gaps between plans and reality makes it easier for you to fix inefficiencies, grab opportunities, and make smarter decisions. This is where modern FP&A tools make a difference. They offer real-time insights, automated variance tracking, and scenario planning to make the process faster and more accurate.
If your current approach feels clunky, it’s time to upgrade. The right tools can save time and give you the clarity to tackle complex financial challenges with confidence. So, are your tools helping you – or holding you back?
Read more: Capital Planning vs Capital Budgeting: The Practical Differences


Financial Statement Analysis: The Complete Guide (With Step-by-Step Process)
Read more
Best Financial Analysis Tools in 2026: Compare Features & Pricing
Read more