Is your business running efficiently, or are you burning cash? Efficiency ratios help you find out. These simple metrics reveal how well you’re using resources like inventory, assets, and receivables to generate revenue.
For example, what’s sitting in your warehouse right now? If inventory isn’t moving, it’s costing you money. What about overdue invoices? Delayed customer payments can cripple your cash flow and slow down your growth.
In this guide, you’ll learn what efficiency ratios are, how to calculate them, and practical steps to improve them, so your business can run smoothly and grow faster.
Read: A Complete Guide to Financial Statement Analysis for Strategy Makers
What Are Efficiency Ratios?
Efficiency ratios tell you how well your business uses resources, that is, how quickly you sell inventory, collect payments, or generate revenue from assets. They serve as a health check for your operations, so to speak.
These metrics are different from profitability ratios. Profitability ratios focus on the result (net income or profit margins) but efficiency ratios zoom in on the process. They tell you how effectively your operations are turning resources into results. For example:
- Profitability ratios show whether your revenue is turning into profit.
- Efficiency ratios show how well you’re managing things like inventory, receivables, or assets to generate that revenue in the first place.
Together, they give you a complete picture: profitability ratios reveal the “what,” while efficiency ratios tell you about the “how.”
The Key Efficiency Ratios (and How to Calculate Them)
The metrics we’re talking about here are not the only efficiency ratios but they focus on critical areas: inventory, payments, and assets, which directly affect cash flow and growth. Let’s break them down with simple examples and formulas.
Inventory Turnover
Inventory Turnover tells you how quickly your business sells and replaces inventory. The formula is:
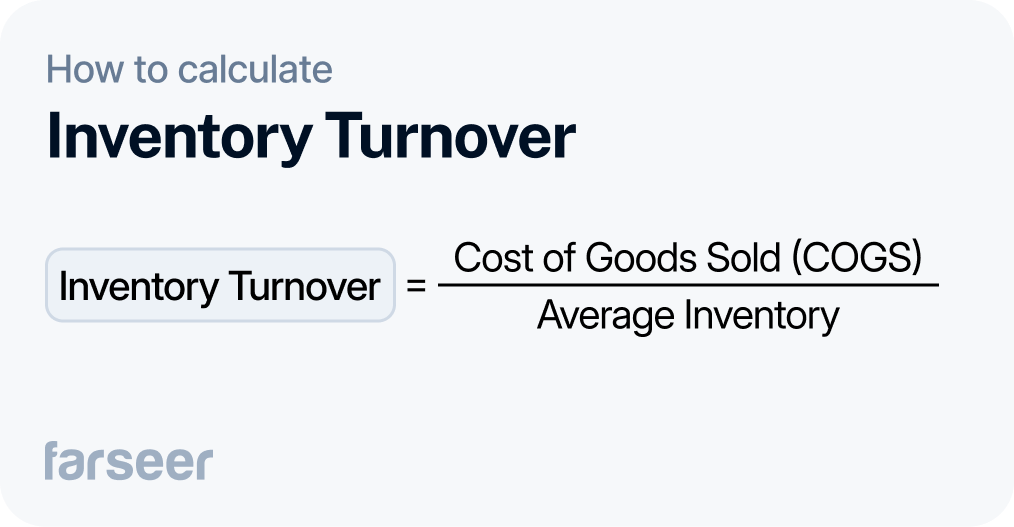
A high turnover means you’re selling products quickly, which is great for cash flow. If it’s too high, you might run into stockouts and lose sales, though. On the other hand, low turnover could mean slow-moving stock, which ties up cash and increases storage costs. When you monitor inventory turnover, you’re making sure that your sales are balanced with your stock levels, and that you have cash freed up for other parts of your business.
Example: A company with $500,000 in COGS and $100,000 in average inventory has an inventory turnover of 5. This means it cycles through its inventory five times per year. They could improve this by improving their demand forecasts or optimizing their supply chain.
Accounts Receivable Turnover
Accounts Receivable Turnover measures how efficiently your business collects payments from customers. The formula is simple:
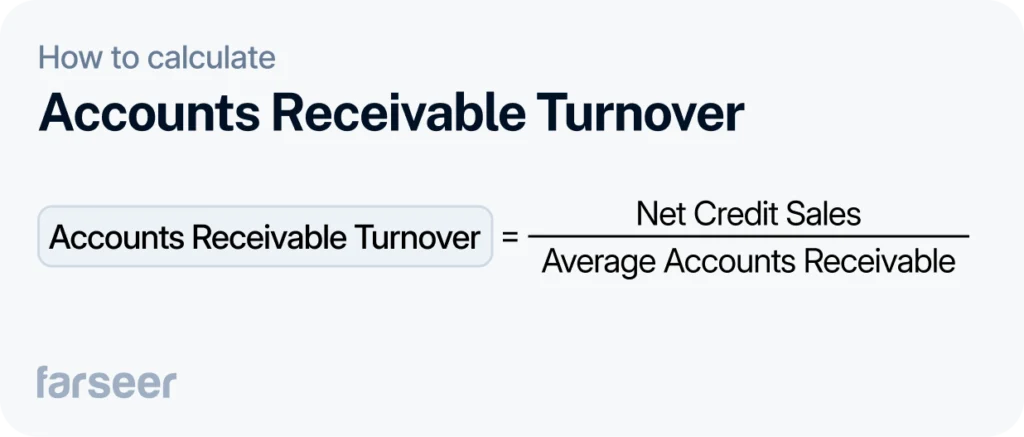
A high ratio means you’re collecting payments quickly, which improves cash flow and reduces the risk of bad debt. A low ratio could mean delays in collections or loose credit policies.
Example: A company with $1,000,000 in net credit sales and an average of $100,000 in accounts receivable has an accounts receivable turnover of 10. This means it collects its receivables 10 times per year. They could improve their collections if they offer early payment discounts, or if they automate invoice reminders.
Since accounts receivable is one of the most important current assets, keeping an eye on it can help you stay liquid and financially healthy.
Accounts Payable Turnover
Accounts Payable Turnover shows how well your business manages payments to suppliers. Keeping an eye on it helps balance cash flow while maintaining healthy relationships with suppliers.
The formula is:

A high turnover means you’re paying suppliers quickly. However, paying too fast can leave you with less cash to cover other important expenses. A low turnover means you’re holding onto cash longer. That can help with liquidity, but delaying payments too much could damage your supplier relationships.
Example: A business with $1,000,000 in net credit purchases and $200,000 in average accounts payable has a turnover of 5. This means they settle their payables five times a year. To improve, they could renegotiate payment terms with suppliers or automate their payment processes to avoid delays.
Asset Turnover
Asset Turnover pinpoints how much revenue your business makes for every dollar of assets. Here’s the formula:
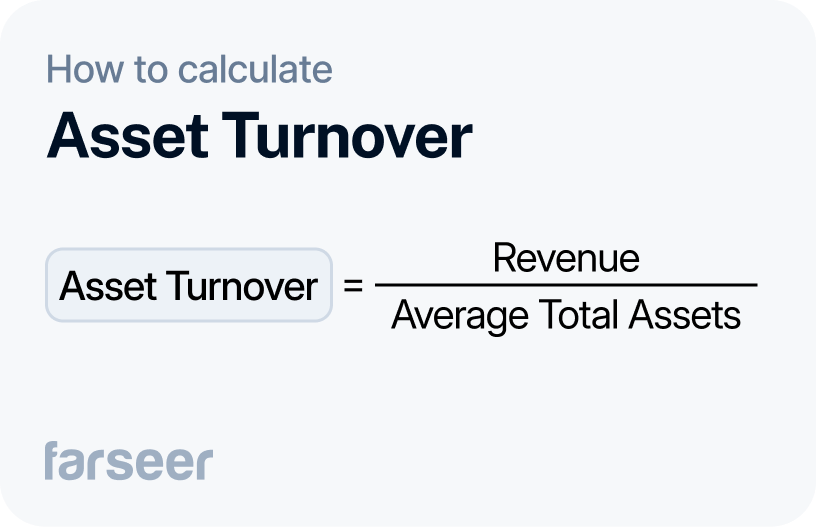
When the turnover is high, you’re using your assets efficiently to drive sales. If it’s low, you could probably make better use of some of your assets.
Example: A business with $2,000,000 in revenue and $500,000 in average total assets has an asset turnover of 4. This means that every dollar of assets makes $4 in revenue. They might try to use their assets better or cut down on unnecessary investments.
This ratio works hand-in-hand with your balance sheet ratios since total assets are important for your company’s financial health.
Days Sales in Inventory (DSI)
DSI tells you how many days it takes to sell your inventory. It’s a simple way to measure how quickly your stock moves. The formula is:
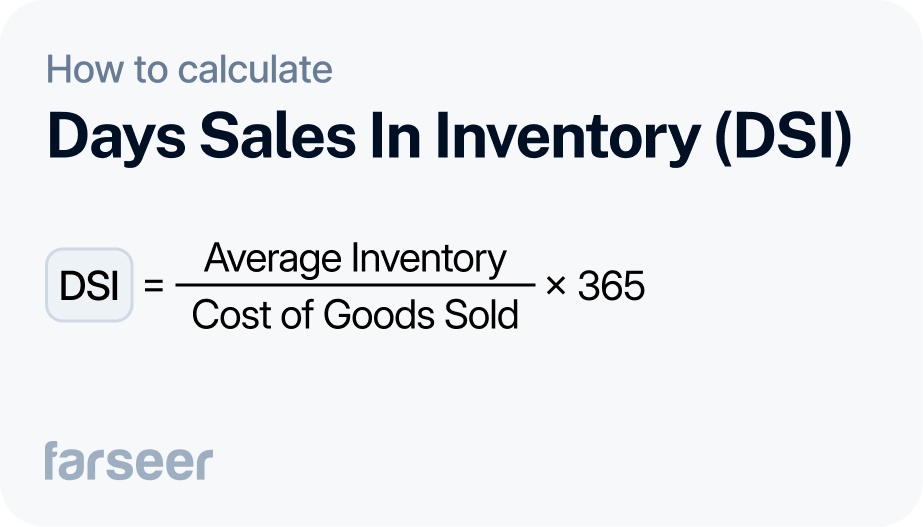
Low DSI means you’re selling inventory quickly. This frees up cash and lowers storage costs. A high DSI means the stock sits on the shelves longer than it should and your capital is tied up.
Example: A company with $200,000 in average inventory and $1,000,000 in COGS has a DSI of 73. This means it usually takes them 73 days to sell their inventory. To improve this, they could change their purchasing strategy or offer discounts to move slow-selling products faster.
DSI helps you keep enough stock to meet demand without tying up too much cash in unsold goods.
Making the Most of Efficiency Ratios
To get the most out of efficiency ratios, track changes over time and focus on the ones that matter most for your business.
Spot Trends
Pay attention to how your ratios change. For example, if your receivables turnover drops, it might mean customers are taking longer to pay. Spotting trends like this early can help you fix problems before they hurt your cash flow.
Tailor to Your Business
Not every ratio matters equally for every business. Retailers care most about inventory turnover, while manufacturers focus on days sales in inventory. Focus on the ones that make the most sense in your operations.
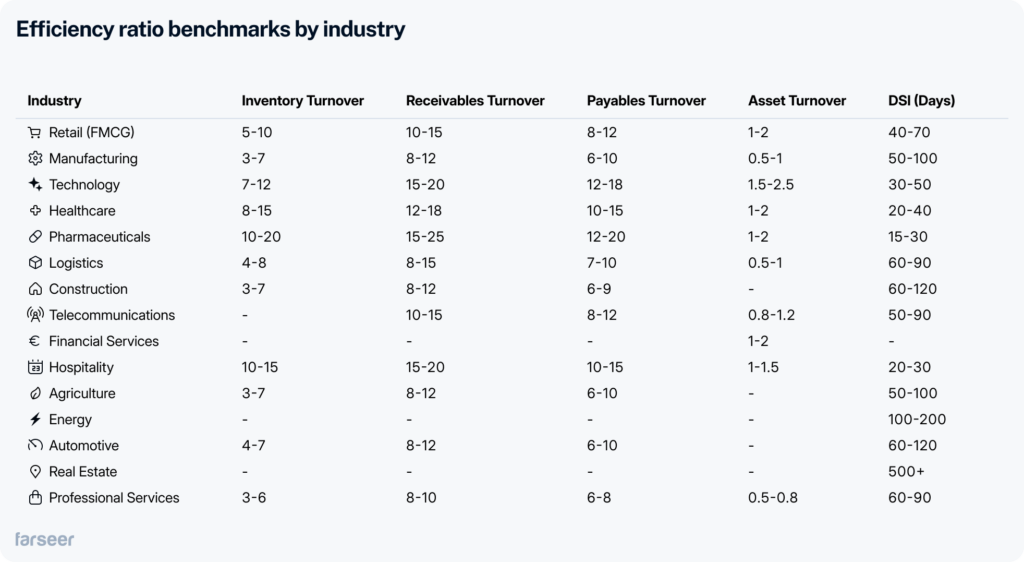
Compare to Industry Benchmarks
It’s always best to compare your ratios to others in your industry to see where you stand.
Here’s a table of efficiency ratio benchmarks by industry to help you:
Understanding the Limitations of Efficiency Ratios
Efficiency ratios are useful, but they have their limits. They can show where your business is doing well or lagging, but they don’t tell the whole story. To get the most out of them, you need to know their weaknesses and combine them with other tools for a full picture of your business.
Here’s a quick overview of the main limitations:
Conclusion
Efficiency ratios are simple but powerful tools for finding inefficiencies and improving your business. By tracking them regularly, you can spot problem areas, improve operations, and make smarter decisions.
The key is to monitor these ratios closely and act on what they reveal. Tools like Farseer make it easy to track these metrics in real-time and turn insights into actions.
