In a nutshell, financial statement analysis is examining a company’s financial statements to assess its financial health and performance. It’s not just looking at numbers though. It’s about making sense of them so you find risks, opportunities to grow and make good business decisions.
Many companies overlook important things in these statements, or they fall into common traps.
Wondering if you are analyzing the right data, or if you’re making critical mistakes in the financial statement analysis? Read on.
3 Most Important Financial Statements
Financial statements are the key ingredient of financial analysis. They tell you if the company is financially healthy, profitable, and how it performs. To decide what’s best for your company, and craft a winning strategy, you’ll need to understand them.
When people talk about financial statements, they talk about the three main ones: balance sheet, income statement (or profit and loss statement), and cash flow statement.
Balance Sheet Analysis
The balance sheet gives you a snapshot of a company’s financial position at a point in time. It tells you about what the company owns, or its assets, what it owes, or its liabilities, and the net worth that can be attributed to the shareholders, its equity.
Assets are split into current (cash, accounts receivable, and inventory) and non-current (long-term investments, property, and equipment). Current assets can be converted into cash within a year, while non-current assets provide value over a longer period.
If you want to learn about the importance of current assets and how you can use it for success of your company, read: How to Make the Current Assets Formula Work for You.
Liabilities are the company’s obligations. Current liabilities are short-term debts and accounts payable (like supplier invoices), while non-current liabilities consist of long-term debts (loans and bonds).
Equity is basically what’s left for shareholders after the company’s liabilities are subtracted from its assets. It contains retained earnings and the shareholders’ invested capital.
If you want to learn how to effectively compare your company’s financial position across multiple periods, read: What’s a Comparative Balance Sheet and Why You Need It
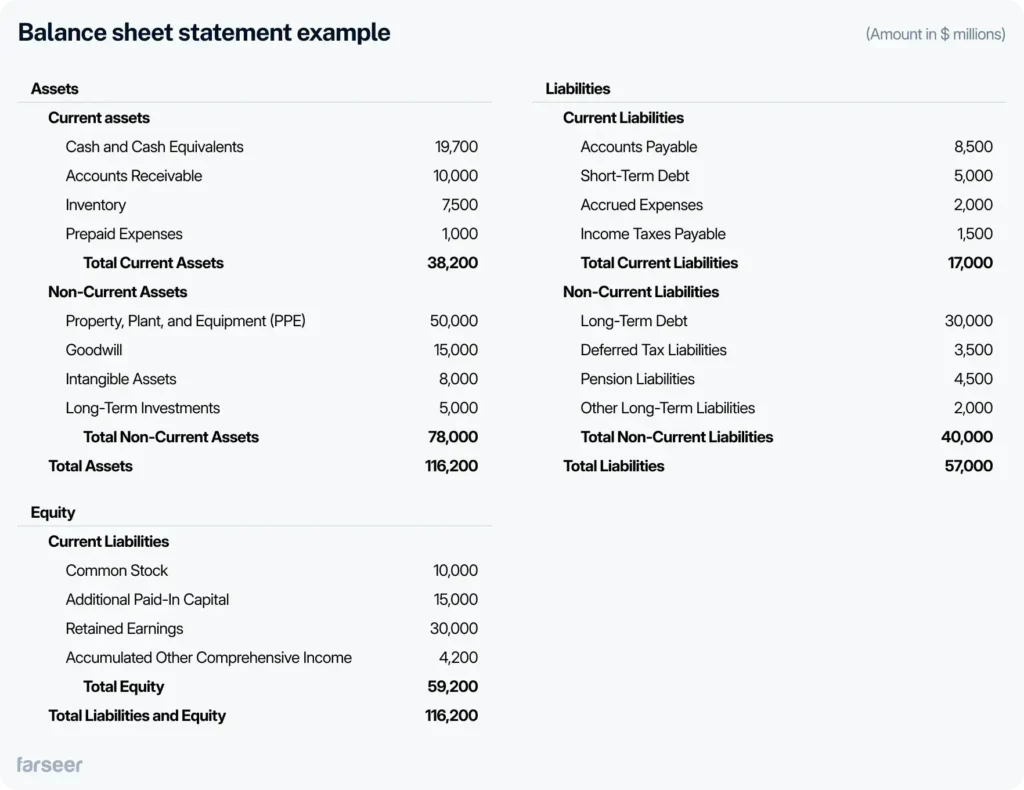
Key metrics from the Balance Sheet
Current Ratio = Current Assets / Current Liabilities
Current ratio gives info about a company’s ability to cover its short-term obligations. Apple’s current ratio was around 1.36 in 2020, for example, reflecting its strong ability to manage liquidity and meet short-term debts.
Debt-to-Equity Ratio = Total Liabilities / Shareholders’ Equity
This one evaluates a company’s financial leverage. In 2020, Tesla’s debt-to-equity ratio was 0.46 by the end of the year, down from 1.35, showing Tesla’s focus on reducing debt and improving its capital structure.
For more information about balance sheet ratios, read: 7 Balance Sheet Ratios for Better Financial Decision-Making
Income Statement (P&L) Analysis
The income statement, or profit and loss (P&L), gives an overview of a company’s financial performance during a certain period. It shows revenues, expenses, and profits, telling you how efficiently the company generates income from its operations.
Revenue is the total income the company generated from its product sales or services.
Expenses are all costs that come with generating revenue: cost of goods sold (COGS), operating expenses (salaries, rent, and utilities), and non-operating costs (interest and taxes).
Net Profit or Net income is what remains after you deduct expenses from revenue. A positive net profit means profitability, while a negative means losses.
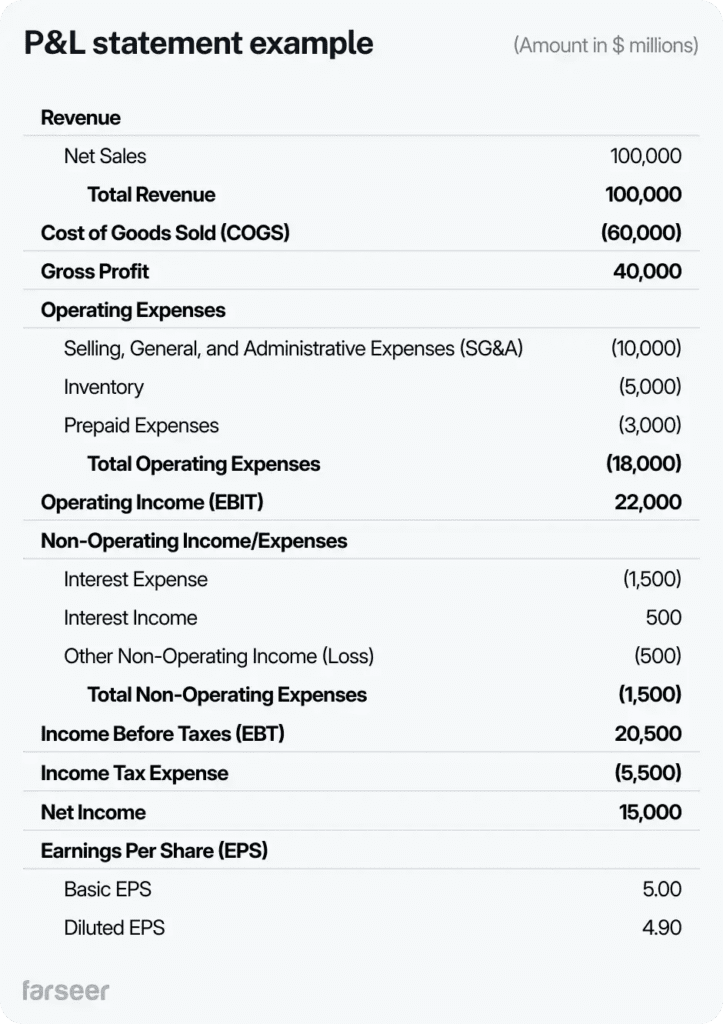
Key Metrics from the Income Statement
Gross Profit Margin = (Revenue – COGS) / Revenue * 100
This metric shows how much of the revenue is left after paying for the cost of goods sold. It shows how well a company manages its production or services. For example, Walmart’s gross profit margin was about 24% in 2020. This means the retailer could control costs in a large operation.
Operating Margin = Operating Income / Revenue * 100
The percentage of revenue remaining after covering operating expenses. In 2020, Netflix’s operating margin was 18%, meaning they were operating efficiently while aggressively expanding globally.
Net Profit Margin = Net Profit / Revenue * 100
This one gives info on profitability after covering all expenses. In 2020, Alphabet (Google) had a net profit margin of around 22%, meaning the significant portion of its revenue was actually profit.
If you want to learn how to prepare an income statement, read: How to Prepare an Income Statement in 5 Simple Steps.
Cash Flow Statement Analysis
The cash flow statement shows how cash goes in and out of the business during a specific period. There are three sections in it: operating activities, investing activities, and financing activities. Cash flow statement tells you if a company is liquid and can it meet its short term obligations.
Operating activities section shows how much cash the company generates or uses for its core operations. It includes cash received from customers and cash paid for expenses like salaries and rent.
Investing activities section tracks cash from buying or selling long-term assets, like property, equipment, and investments.
Financing activities section shows the cash coming in and going out related to financing the company. It covers things like issuing debt or equity, paying dividends, and repaying loans.
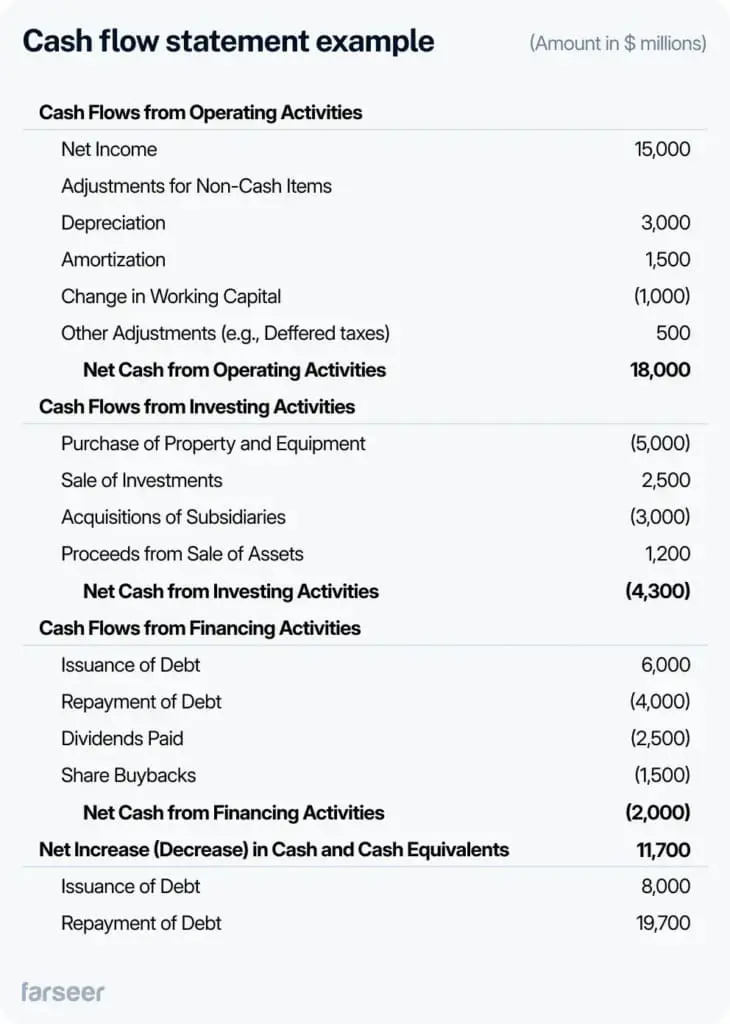
Key Metric from the Cash Flow Statement
Free Cash Flow = Operating Cash Flow – Capital Expenditures (CAPEX)
Free cash flow (FCF) shows how much cash a company has left after covering capital expenses. It’s the money available for reinvesting in the business, paying dividends, or reducing debt. For example, in 2023, Amazon generated around $35.5 billion in FCF, which was a big improvement from the previous year – they were efficient and could invest a lot in further growth.
Horizontal, Vertical, and Ratio Analysis
Horizontal, vertical, and ratio analysis are the basic and most important techniques of financial statement analysis. They work together to give a complete picture of a company’s financial health.
Horizontal Analysis
In horizontal analysis you compare financial data across multiple periods, showing trends and growth patterns over time. The name “horizontal” stems from the comparison being made horizontally across the financial statement.
Typically, it’s across columns that represent different periods. By calculating the percentage change in key figures like revenue, expenses, or profits, this method helps assess if the performance is improving or declining.
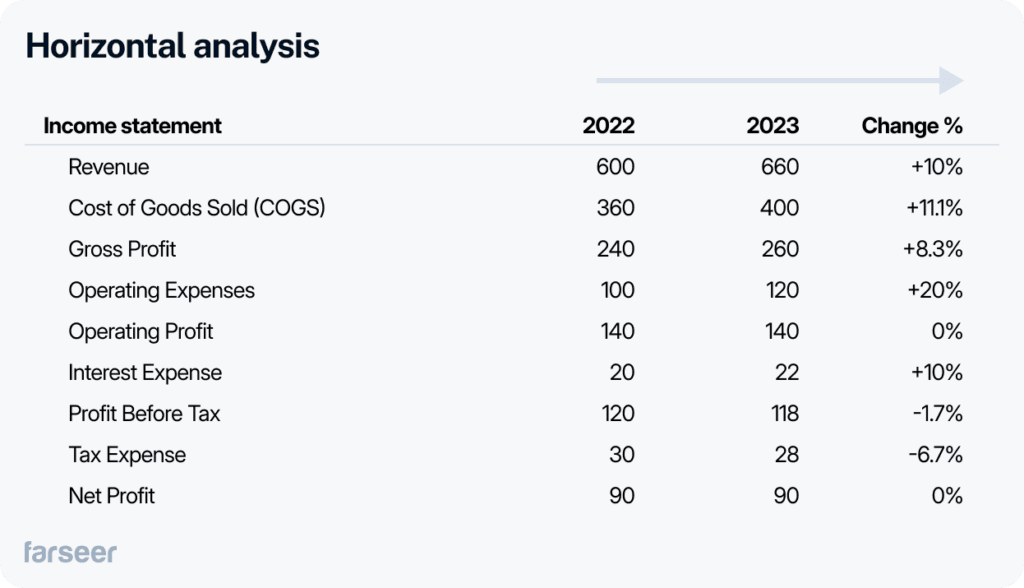
In the example above, the revenue increased by 10%, but operating expenses and interest costs did too. That prevented increase in net profit.
Vertical Analysis
In vertical analysis you express each line item in a statement as a percentage of a base figure, such as total revenue for the income statement or total assets for the balance sheet. It’s called “vertical” because you compare line items vertically, down the financial statement. Each item is represented as a percentage of the main figure (revenue in this case). This way you can compare financial structure across periods or against industry benchmarks, and find key differences and trends.

In the picture, vertical analysis shows that 60.6% of revenue is spent on COGS. Net profit is 13.6% of total revenue.
Ratio Analysis
Ratio analysis is another crucial part of financial statement analysis. It evaluates a company’s performance through key financial ratios of line items from the balance sheet and P&L statement. The ratios measure profitability, liquidity, leverage, efficiency, valuation and working capital.
Key Financial Ratios
In the next section, we’ll focus on the most important financial ratios that help break down the company’s financial performance.
Profitability Ratios
Profitability ratios measure how well a company generates profit in relation to its revenue, assets, or shareholders’ equity. In simple words, they tell you can the company generate returns for its investors. Here are the most common ones:
Gross Profit Margin shows how much of the revenue company retains after covering the cost of goods sold (COGS). A higher number means more revenue is left to cover other expenses and profit.
Gross Profit Margin = (Revenue – COGS) / Revenue * 100
Net Profit Margin is the percentage of revenue that turns into profit after covering expenses, taxes, and interest. A higher number means better efficiency in turning sales into profit.
Net Profit Margin = Net Profit / Revenue * 100
Return on Assets (ROA) tells us how efficient is the company in using its assets to generate profit. Higher ROA means the company is making better use of its investments in assets.
ROA = Net Income / Total Assets
Return on Equity (ROE) shows how well the company uses shareholder equity to generate profit. It tells investors how effectively their money is used.
ROE = Net Income / Shareholders’ Equity
Liquidity Ratios
Liquidity ratios measure if the company can meet its short-term obligations. They provide insights into the company’s financial health and ability to cover liabilities with available assets.
Current Ratio shows if a company has enough assets to cover its short-term liabilities. If it’s above 1, the company can meet its obligations. If it’s below, there might be liquidity issues.
Current Ratio = Current Assets / Current Liabilities
Quick Ratio, or acid-test ratio excludes inventory and focuses on more liquid assets. That way, it gives a more precise view of liquidity.
Quick Ratio = (Current Assets – Inventory) / Current Liabilities
Cash Ratio measures if the company can pay off debts using only cash and equivalents. It’s the most conservative view of liquidity.
Cash Ratio = Cash and Cash Equivalents / Current Liabilities
Leverage Ratios
Leverage ratios show how much of its operations the company finances through debt. They help to evaluate financial risk, and if the company relies on borrowed funds too much.
Debt-to-Equity Ratio compares the company’s total liabilities to its shareholders’ equity. A higher ratio means the company relies more on debt to finance its operations, which could might be risky.
Debt-to-Equity Ratio = Total Liabilities / Shareholders’ Equity
Interest Coverage Ratio measures if a company can cover its interest payments with its operating income easily. A higher ratio shows the company has earned enough to cover its debt.
Interest Coverage Ratio = Operating Income / Interest Expense
Debt Ratio shows the proportion of the company’s assets financed through debt. The higher the ratio, the greater the financial leverage and risk.
Debt Ratio = Total Liabilities / Total Assets
Efficiency Ratios
Efficiency ratios measure how well a company uses its assets and liabilities to generate revenue. They tell you how effectively the company is managing its resources and if it’s operationally efficient.
Asset Turnover Ratio shows if a company uses its assets to generate sales efficiently. A higher number means the company is generating more sales for each dollar of assets, i.e. using its assets more effectively.
Asset Turnover Ratio = Revenue / Total Assets
Inventory Turnover Ratio measures how quickly a company sells and replaces its inventory over a period. A higher ratio means it manages its inventory more efficiently.
Inventory Turnover Ratio = COGS / Average Inventory
Receivables Turnover Ratio tells you how efficiently the company collects debts from customers. A higher number means it’s quick, which improves liquidity. A low number could mean issues with credit policies or payment collection.
Receivables Turnover Ratio = Net Credit Sales / Average Accounts Receivable
Valuation Ratios
Valuation ratios measure a company’s market value compared to its financial performance.. Investors often use them to evaluate if a company’s stock is over or undervalued.
Price-to-Earnings (P/E) Ratio shows how much investors are willing to pay for each dollar of earnings. A higher P/E means growth expectations. A lower may signal undervaluation or risk.
P/E Ratio = Market Price per Share / Earnings per Share
Price-to-Book (P/B) Ratio compares a company’s market value to its book value. A lower P/B ratio can mean that a company is in distress or undervalued.
P/B Ratio = Market Price per Share / Book Value per Share
Enterprise Value to EBITDA (EV/EBITDA) measures a company’s overall value (including debt) relative to its EBITDA. It helps assess profitability and valuation. A lower EV/EBITDA may suggest undervaluation. A higher number can mean growth potential or overvaluation.
EV/EBITDA = Enterprise Value / EBITDA
Working Capital Ratios
These ratios show how well a company manages its short-term assets and liabilities to maintain liquidity and run smoothly.
Working Capital Ratio shows if the company’s can cover its short-term liabilities with short-term assets. If it’s above 1 that usually means good liquidity. When below 1, it mean financial difficulties.
Working Capital Ratio = Current Assets / Current Liabilities
Days Sales Outstanding (DSO) shows how quickly a company collects payments after a sale. A lower DSO means that it collects payments faster, and the cash flow is better.
DSO = (Accounts Receivable / Revenue) * Number of Days
Days Inventory Outstanding (DIO) measures how long it takes for inventory to be sold. A lower DIO means faster inventory turnover and better cash flow.
DIO = (Inventory / COGS) * Number of Days

Financial Statement Analysis in Forecasting and Budgeting
Financial statement analysis is key for creating reliable forecasts and budgets. Companies can examine past performance data and spot trends that can help them set a course for the future. Using key ratios (profit margin, liquidity ratios, etc.) can help them focus their attention on the most important areas, and they can use them to refine budgets and manage their resources more effectively. Planning various scenarios for different versions of their forecasted statements helps set contingencies. Rolling forecasts allow them to make adjustments in real-time, as business happens, so they can meet both short and long term goals.
Read: Budgeting vs Forecasting – Key Differences and When to Use Each?
Examples of Smart Business Decisions from Financial Statement Analysis
It’s important to remember that financial statement analysis is a tool used for making better and more informed business decisions. All metrics we mentioned make sense only if you use them to improve your business. Let’s look at how some businesses have done exactly that.
Amazon Allocated Capital to AWS
After an in-depth analysis, Amazon decided to change their strategy, and heavily invest in Amazon Web Services (AWS). The analysis showed the enormous growth potential outside e-commerce, their main activity up to that point. AWS accounts for over 70% of Amazon’s operating income today.
McDonald’s Cut Cost Significantly
In 2020, during the COVID-19 pandemic, McDonald’s used financial statement analysis to learn more about where it could cut costs without sacrificing performance. The company decided to cut costs without sacrificing performance. They simplified the menu, cut less popular items, and optimized and sped up their operations. Although their profits decreased by 22% that year, they avoided deeper losses and stayed in business.
Microsoft Acquired LinkedIn
Microsoft took a data-driven approach when deciding if they should acquire LinkedIn. They focused on revenue growth, the enormous potential of LinkedIn’s user base, and its potential integration with their existing enterprise products. Their analysis showed that the $26.2 billion acquisition is a good idea. That strengthened Microsoft’s position and made it a leader in enterprise social networking. The rest is history.

Airbnb Successfully Managed Risk
During the 2020 pandemic, Airbnb faced liquidity risks due to the sudden drop in travel demand. By thoroughly analyzing its financials, the company identified this risk early and raised $2 billion in financing to stabilize the business. This proactive approach, driven by financial analysis, helped Airbnb weather the crisis and eventually go public.
It’s important to add that everything mentioned above is not the result of a one-off analysis, but rather ongoing effort and analysis that these businesses conducted.
Technological Advances in Financial Statement Analysis
Technology has transformed financial analysis, making it faster and more efficient. Automation tools handle repetitive tasks like data entry and report generation. Robotic Process Automation (RPA) automates routine tasks, while AI-powered tools detect anomalies and predict future trends. Data collection and reporting tools gather real-time data, producing up-to-date financial statements without manual work. Workflow automation speeds up processes like approvals and financial close cycles.
Data visualization tools turn complex numbers into easy-to-understand dashboards, helping teams spot trends quickly. Integrated ERP systems ensure all financial data is centralized and consistent, providing accurate, real-time financial insights across departments.
Tools like Farseer combine automation, scenario planning, real-time analysis, and rolling forecasts, allowing businesses to stay flexible and make proactive decisions.
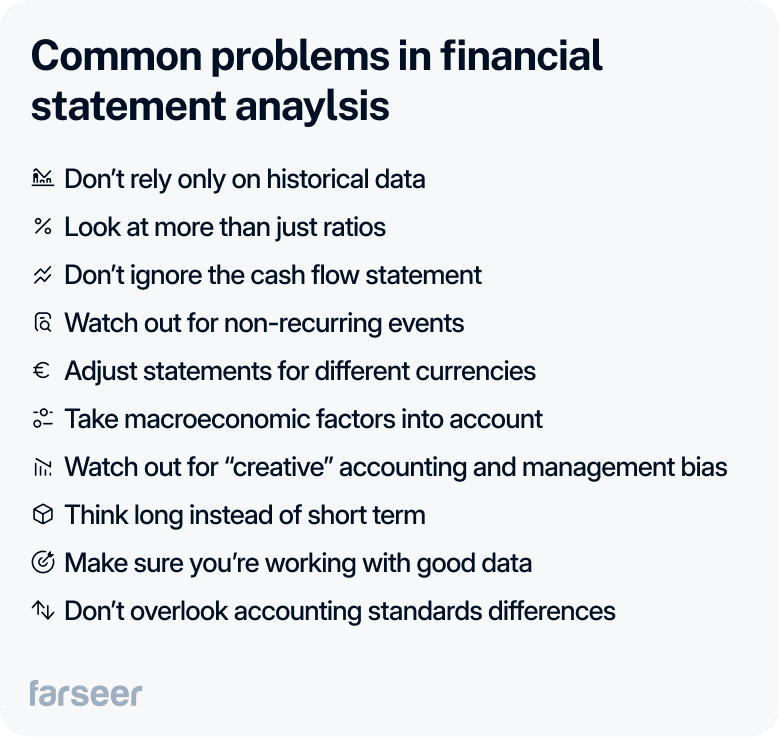
Common Problems (and Solutions) in Financial Statement Analysis
No matter how experienced you are, problems can still happen when analyzing financial statements. Here are some of the most common ones and what to do about them.
Don’t rely only on historical data
Problem: People often assume that past performance will predict future results more than they should. But markets change. Conditions change. Relying only on historical data is dangerous.
Solution: Enrich your historical data with the latest trends and forecasts. Don’t forget market shifts or new competitors that could affect your future performance.
Look at more than just ratios
Problem: Ratios are great, but looking at them without context – like industry standards or the company’s size can be misleading.
Solution: Always look at ratios within a broader context. Compare them to industry benchmarks, historical performance, and the specific situation of the company.
Don’t ignore the cash flow statement
Problem: Focusing too much on the P&L statement and balance sheet and neglecting the cash flow can hide dangerous liquidity issues.
Solution: Analyze cash flow to see if the company manages its cash well. It’s crucial for day-to-day operations and long-term survival.
Watch out for non-recurring events
Mistake: One-time events, like asset sales or restructuring, can distort a company’s profitability if they’re not taken into account.
Solution: Always adjust for non-recurring events to get a clearer view of the company’s true performance.
Adjust statements for different currencies
Problem: For international companies, currency fluctuations can affect financial results and skew key ratios.
Solution: When analyzing financial statements, don’t forget to adjust for different currencies.
Take macroeconomic factors into account
Problem: Inflation can make financial results look better or worse than they really are. Better revenue doesn’t necessarily mean better profit.
Solution: Always factor in inflation and other economic shifts when evaluating a company’s performance.
Watch out for “creative” accounting and management bias
Problem: Companies may use clever accounting tricks or overly optimistic projections to make their financials look better than they are.
Solution: Dig deeper, analyze trends, cross-check everything, and be careful about management bias.
Think long instead of short term
Problem: Focusing on short-term results, like quarterly earnings, can distract from the bigger picture.
Solution: Balance short-term performance with long-term trends. Look at the company’s strategy and how it plans to grow over time, not just its most recent results.
Make sure you’re working with good data
Problem: Lousy or incomplete data leads to bad decisions. That’s a fact. The smallest data errors can have big consequences.
Solution: Do whatever you can to make sure the data you’re working with is accurate, complete, and up-to-date.
Don’t overlook accounting standards differences
Problem: Different accounting standards (like U.S. GAAP vs. IFRS) can, and will complicate financial analysis. Inconsistent practices in asset valuation or revenue recognition can distort financial results.
Solution: Be aware of the accounting standards used and adjust your analysis when comparing financials from different regions or companies.
Conclusion
Financial statement analysis is a strategic tool that can drive informed business decisions. By understanding key financial statements and applying analysis techniques like ratio evaluation, scenario planning, and forecasting, companies can manage risks, seize opportunities, and adapt to changing conditions.
Whether improving profitability, managing debt, or planning for the future, consistently analyzing financial data ensures your company stays on course and continues to grow. Make sure to apply these insights to enhance decision-making and boost your business performance.
When analyzing financial statements, it’s important to understand that they come with certain limitations. To learn more about these limitations and strategies to overcome them, read: 4 Critical Financial Statement Limitations and How to Overcome Them.


